. 2013 Jan;41(2):e38.
doi: 10.1093/nar/gks1034. Epub 2012 Nov 11.

A multi-parametric flow cytometric assay to analyze DNA-protein interactions

Affiliations

A multi-parametric flow cytometric assay to analyze DNA-protein interactions

Mandana Arbab et al. Nucleic Acids Res. 2013 Jan.

Abstract

Interactions between DNA and transcription factors (TFs) guide cellular function and development, yet the complexities of gene regulation are still far from being understood. Such understanding is limited by a paucity of techniques with which to probe DNA-protein interactions. We have devised magnetic protein immobilization on enhancer DNA (MagPIE), a simple, rapid, multi-parametric assay using flow cytometric immunofluorescence to reveal interactions among TFs, chromatin structure and DNA. In MagPIE, synthesized DNA is bound to magnetic beads, which are then incubated with nuclear lysate, permitting sequence-specific binding by TFs, histones and methylation by native lysate factors that can be optionally inhibited with small molecules. Lysate protein-DNA binding is monitored by flow cytometric immunofluorescence, which allows for accurate comparative measurement of TF-DNA affinity. Combinatorial fluorescent staining allows simultaneous analysis of sequence-specific TF-DNA interaction and chromatin modification. MagPIE provides a simple and robust method to analyze complex epigenetic interactions in vitro.


Figures

Figure
1.
Figure 1.
MagPIE experimental flowchart. (A) Genomic regions are amplified by PCR using sequence-specific primers linked to MagPIE primer sequences predicted to have low TF-binding affinity. The DNA is further amplified using a biotinylated MagPIE reverse primer and a MagPIE forward primer that may be tagged with a fluorophore. (B) Biotinylated DNA is captured on SA-coated magnetic beads. (C) Bead-immobilized DNA is incubated with crude nuclear protein lysate in the presence of competitor poly(dI:dC) DNA to pull down sequence-specific nuclear factors in a 10-min binding reaction at 37°C. (D) TFs and other DNA-bound proteins are immunostained with fluorescently tagged antibodies, and fluorescence intensity is analyzed by flow cytometry.
Figure
2.
Figure 2.
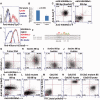
MagPIE allows flow cytometric detection of TF-DNA binding. Flow cytometric plots showing bead immunofluorescence intensity for V5 tagged Cdx2 (Y axis) vs. autofluorescence (X axis) for beads coated with 150 bp Cdx2-binding site containing DNA (A) or 130 bp randomized DNA (B) and incubated with lysate from mES cells ectopically expressing V5-tagged Cdx2. Intensity is provided as percentage of events above a threshold, which is set at background level to simplify the distinction of signal to noise. (C) Graph showing percentage of beads above a threshold level of flow cytometric V5-tagged Cdx2 immunofluorescence (Y axis) vs. concentration of lysate from mES cells ectopically expressing Cdx2 in cell number equivalent per microliter (X axis). Flow cytometric plots showing bead immunofluorescence intensity for V5-tagged Cdx2 (Y axis) vs. autofluorescence (X axis) for beads coated with 88 bp DNA sequences containing a 40 bp Cdx2 binding site (D, sequence shown as WT in panel F) or 88 bp DNA sequences containing a 40 bp Cdx2 mutant binding site (E, sequence shown as no. 1 in F) and incubated with lysate from mES cells ectopically expressing V5-tagged Cdx2. (F) Mutation series of a 40 bp enhancer fragment with Cdx2 ChIP-seq binding containing a strong Cdx2 binding site (underlined, with Uniprobe motif overlaid above sequence) and a weak Cdx2 binding site (italicized) with mutations bolded. Amplified enhancer fragments have a total DNA length of 88 bp. (G) Bar plot showing percentage of beads above a threshold level of flow cytometric V5 tagged Cdx2 immunofluorescence (Y axis, normalized to WT as 100%) for beads coated with DNA containing the 10 40 bp sequences shown in panel F and a negative control with 48 bp MagPIE primer sequence alone and incubated with lysate from mES cells ectopically expressing Cdx2. (H) Comparative flow cytometric plots showing bead immunofluorescence intensity for Onecut1 (X axis) for beads coated with 138 bp Onecut1 binding site-containing enhancer DNA (black) or 188 bp Onecut1 binding site mutant DNA (red) and incubated with lysate from mES cells ectopically expressing Onecut1. (I) Comparative flow cytometric plots showing bead immunofluorescence intensity for Sox2 (X axis) for beads coated with 88 bp DNA sequences containing a 40 bp Sox2 binding site (black) or 88 bp DNA sequences containing a 40 bp Sox2 mutant binding site (red) and incubated with lysate from wild-type mES cells.
Figure 3.
Figure 3.
MagPIE allows accurate comparative analysis of TF-DNA binding affinities. (A) Comparative flow cytometric plots showing bead immunofluorescence intensity for V5 tagged Cdx2 (X axis) for beads coated with 48 bp MagPIE primer DNA (green) or beads coated with 62 bp DNA sequences containing 8-mers of differing predicted Cdx2 affinity (purple, yellow, red, blue and black) and incubated with lysate from mES cells ectopically expressing Cdx2. Graphs showing percentage of beads above a threshold level of flow cytometric V5 tagged Cdx2 immunofluorescence normalized, such that the flow cytometric percentage of Cdx2+ beads in the strongest predicted binding sequence was set to 1 (Y axis) vs. Cdx2 PBM Z scores normalized, such that the highest score was set to 1 (B, X axis) or log-likelihood ratio scoring against the ChIP-Seq Cdx2 motif PWM (C, X axis). R2 values for the best fit exponential curves are shown on the graphs.
Figure
4.
Figure 4.
MagPIE allows simultaneous monitoring of protein–DNA binding and epigenetic DNA and histone methylation. (A) Comparative flow cytometric plots showing bead immunofluorescence intensity for methyl-CpG (X axis) for beads coated with 88 bp DNA containing 40 bp randomized sequences flanking two CG dinucleotides and incubated without lysate (black), with lysate from mES cells (red) or with lysate from mES cells and RG108 (blue). (B) Graph showing mean bead fluorescence for H3K4Me1 after incubation with mES lysate for a set of DNA regions with (left) or without (right) ChIP-Seq H3K4Me1 marking (sequences in Supplementary Table S1). Flow cytometric plots showing bead immunofluorescence intensity for Sox2 (Y axis) vs. bead immunofluorescence intensity for histone 3 lysine 4 monomethyl (X axis) for beads coated with a 200 bp DNA sequence that does (C) or a 226 bp sequence that does not (D) show Sox2 binding and H3K4Me1 marking in mES cells in vivo. (E) Comparative flow cytometric plots showing bead immunofluorescence intensity for Histone H3 total protein (X axis) for beads coated with DNA from a H3K4Me1+ mES region (black) or from a H3K4Me1- mES region (red) and incubated with mES lysate and compared with DNA-coated beads without lysate (blue). (F) Mutation series of a 40 bp enhancer fragment with a strong SoxOct binding site (Sox binding site underlined, Oct binding site italicized with JASPAR motif overlaid above sequence) with mutations bolded. Amplified enhancer regions have a total DNA length of 88 bp. Flow cytometric plots showing bead immunofluorescence intensity for Sox2 (Y axis) vs. bead immunofluorescence intensity for histone 3 lysine 4 monomethyl (X axis) for beads coated with 48 bp primer DNA (G), 88 bp DNA sequences containing a 40 bp SoxOct wild-type binding site (H), 88 bp DNA sequences containing a 40 bp SoxOct Sox mutant binding site (I) or 88 bp DNA sequences containing a 40 bp SoxOct Oct mutant binding site (J) and incubated with lysate from mES cells. Flow cytometric plots showing bead immunofluorescence intensity for V5 tagged Cdx2 (Y axis) vs. bead immunofluorescence intensity for histone 3 lysine 4 monomethyl (X axis, K and L) or FITC total protein (X axis, M and O) for beads coated with 88 bp DNA sequences containing a 40 bp Cdx2 binding site (K, M and N) or 88 bp DNA sequences containing a 40 bp Cdx2 mutant binding site (L and O) and incubated with lysate from mES cells ectopically expressing Cdx2 (K, L, N and O) or without lysate (M).

References

    1. Koch F, Jourquin F, Ferrier P, Andrau JC. Genome-wide RNA polymerase II: not genes only! Trends Biochem. Sci. 2008;33:265–273. - PubMed
    1. Kee BL, Arias J, Montminy MR. Adaptor-mediated recruitment of RNA polymerase II to a signal-dependent activator. J. Biol. Chem. 1996;271:2373–2375. - PubMed
    1. Rundlett SE, Carmen AA, Suka N, Turner BM, Grunstein M. Transcriptional repression by UME6 involves deacetylation of lysine 5 of histone H4 by RPD3. Nature. 1998;392:831–835. - PubMed
    1. Workman JL, Kingston RE. Alteration of nucleosome structure as a mechanism of transcriptional regulation. Annu. Rev. Biochem. 1998;67:545–579. - PubMed
    1. Johnson DS, Mortazavi A, Myers RM, Wold B. Genome-wide mapping of in vivo protein-DNA interactions. Science. 2007;316:1497–1502. - PubMed

Publication types