. 2012 Dec;122(12):4505-18.
doi: 10.1172/JCI63735. Epub 2012 Nov 12.

Cancer susceptibility and embryonic lethality in Mob1a/1b double-mutant mice

Affiliations

Cancer susceptibility and embryonic lethality in Mob1a/1b double-mutant mice

Miki Nishio et al. J Clin Invest. 2012 Dec.

Abstract

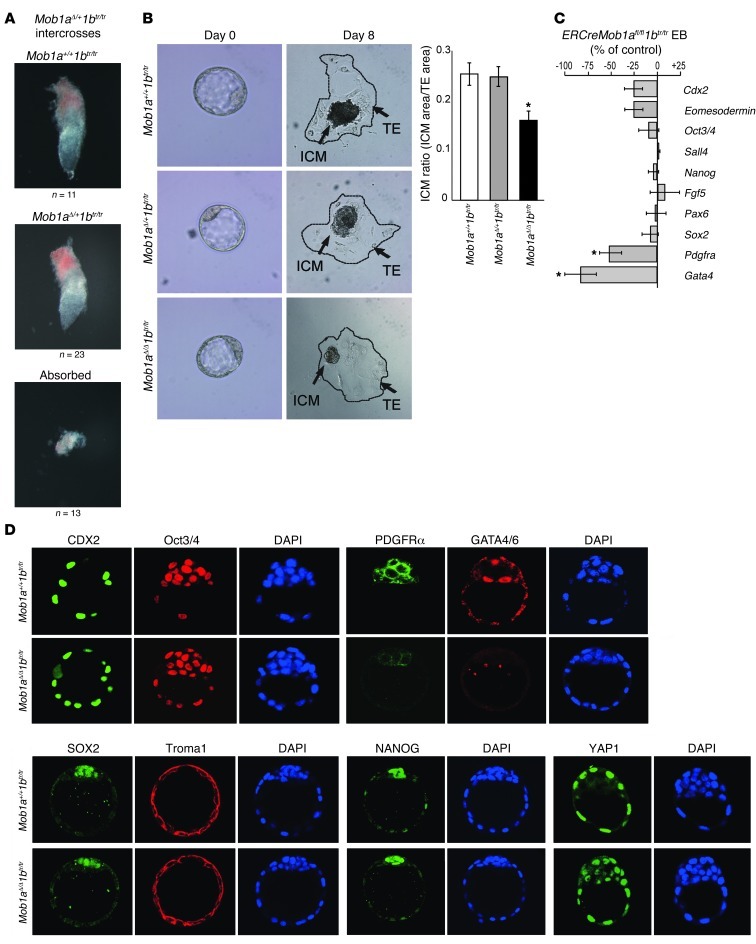
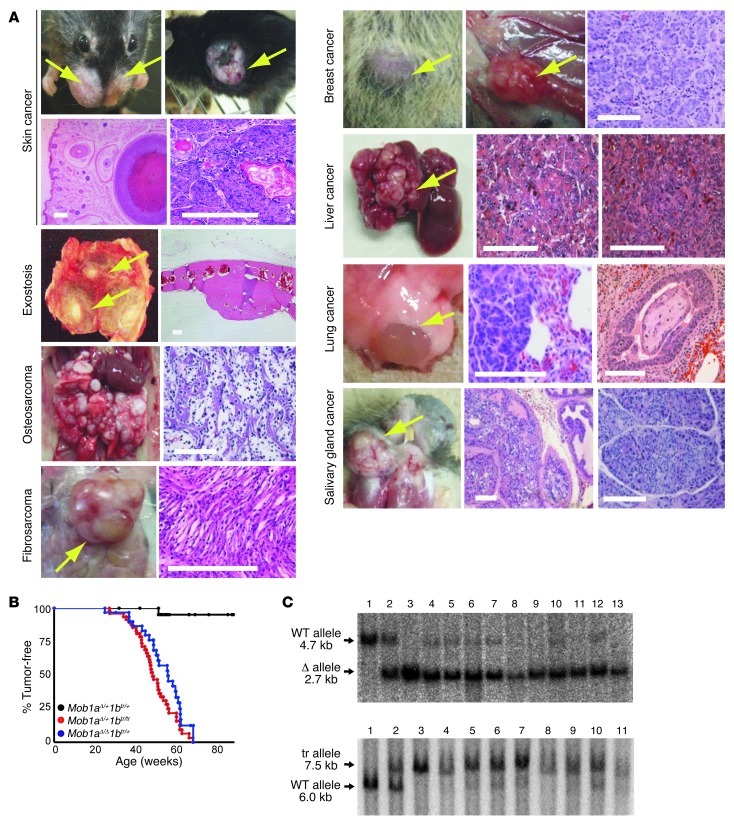
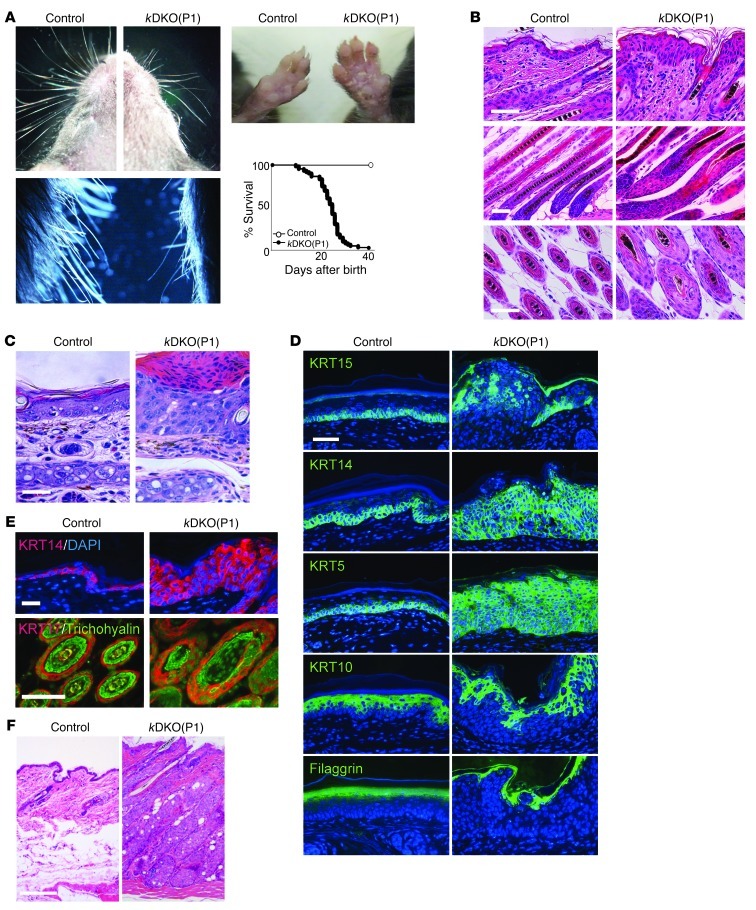
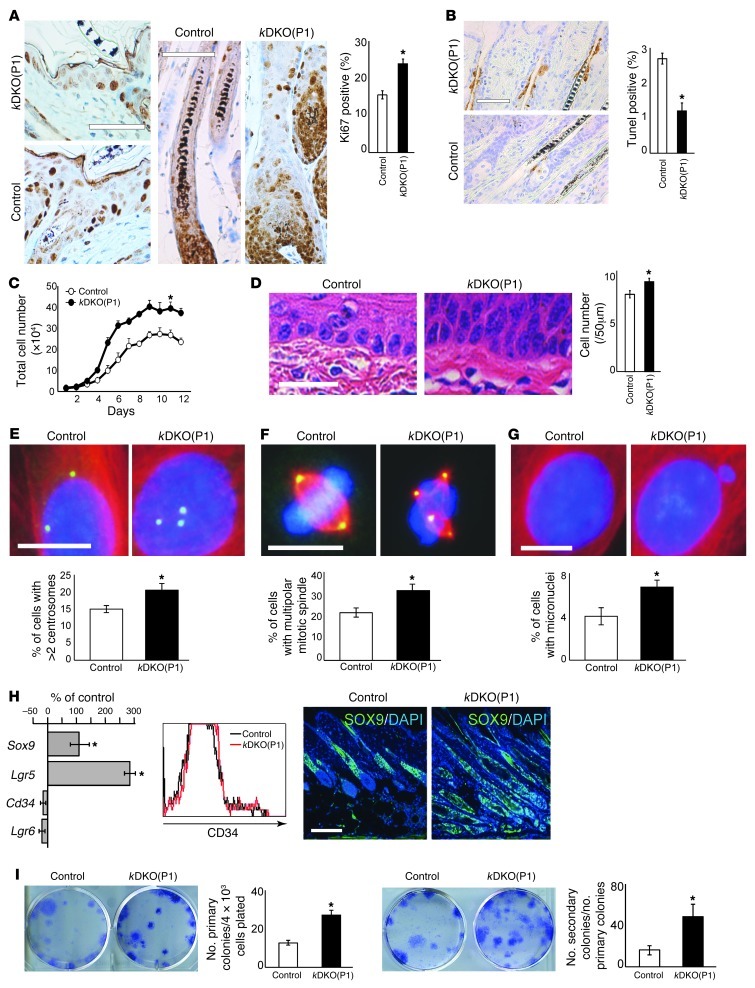
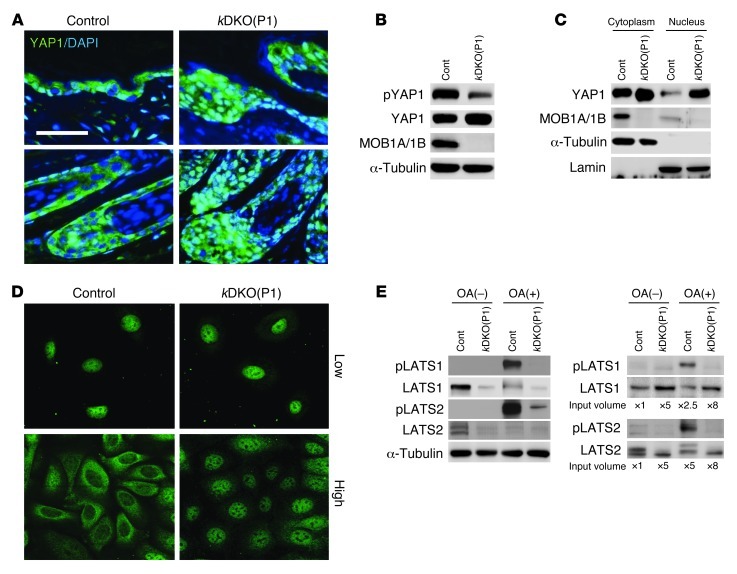
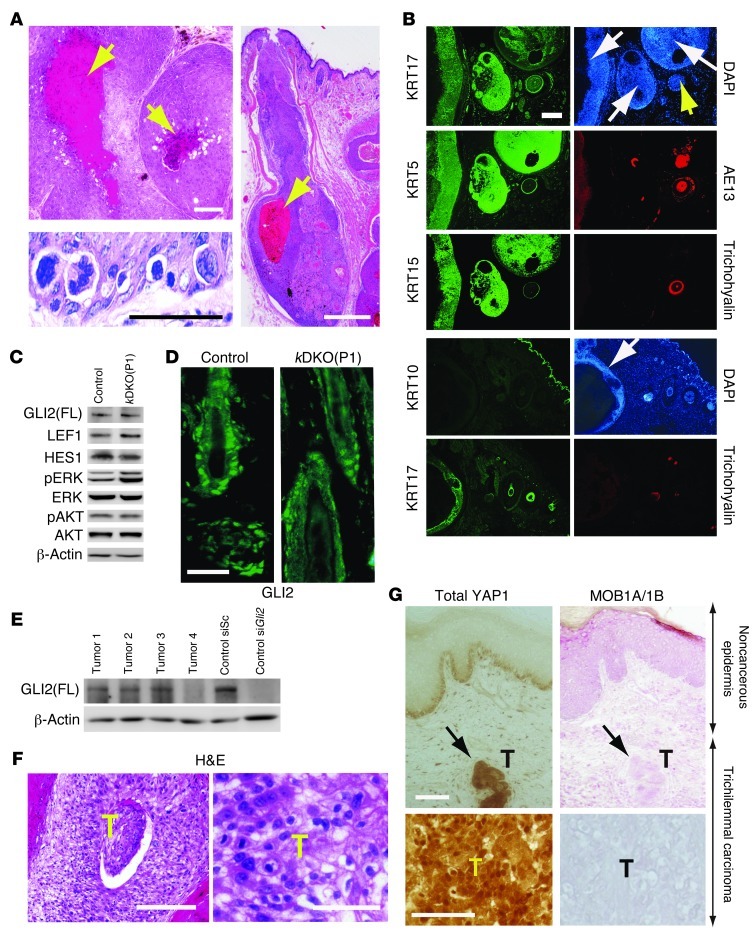
Mps one binder 1a (MOB1A) and MOB1B are key components of the Hippo signaling pathway and are mutated or inactivated in many human cancers. Here we show that intact Mob1a or Mob1b is essential for murine embryogenesis and that loss of the remaining WT Mob1 allele in Mob1a(Δ/Δ)1b(tr/+) or Mob1a(Δ/+)1b(tr/tr) mice results in tumor development. Because most of these cancers resembled trichilemmal carcinomas, we generated double-mutant mice bearing tamoxifen-inducible, keratinocyte-specific homozygous-null mutations of Mob1a and Mob1b (kDKO mice). kDKO mice showed hyperplastic keratinocyte progenitors and defective keratinocyte terminal differentiation and soon died of malnutrition. kDKO keratinocytes exhibited hyperproliferation, apoptotic resistance, impaired contact inhibition, enhanced progenitor self renewal, and increased centrosomes. Examination of Hippo pathway signaling in kDKO keratinocytes revealed that loss of Mob1a/b altered the activities of the downstream Hippo mediators LATS and YAP1. Similarly, YAP1 was activated in some human trichilemmal carcinomas, and some of these also exhibited MOB1A/1B inactivation. Our results clearly demonstrate that MOB1A and MOB1B have overlapping functions in skin homeostasis, and exert their roles as tumor suppressors by regulating downstream elements of the Hippo pathway.


Figures

Figure 1
Figure 1. Loss of Mob1a/1b impairs mouse embryo survival.
(A) Morphologies of representative E6.5 embryos of the indicated genotypes from Mob1aΔ/+1btr/tr intercrosses. Mob1aΔ/Δ1btr/tr embryos were absorbed after implantation. (B) Left: photographs of E3.5 blastocysts of the indicated genotypes on day 0 and after culture for 8 days. The ICM is surrounded by TE giant cells. Right: mean ICM ratio (ICM area/TE area) ± SEM plotted for blastocysts of the indicated genotypes (n = 8/group); *P < 0.01. (C) Quantitative PCR determination of mRNAs for the indicated genes in EBs generated from ERCreMob1afl/fl1btr/tr ES cells. ES cells were cultured with/without tamoxifen for 2 days, and control and mutant EBs were generated using the hanging drop method after culture for 3 days (Cdx2, Eomesodermin, Oct3/4, Sall4) or 4 days (Nanog, Fgf5, Pax6, Sox2, Pdgfra, Gata4). mRNA levels in the mutant are expressed as the percentage increase over control values; *P < 0.05. (D) Immunostaining to detect the indicated proteins in blastocysts of the indicated genotypes. Nuclei were visualized with DAPI. Results shown are representative of at least 3 independent trials and at least 3 mice/group. Data are presented as the mean ± SEM, and P values were determined using the 2-tailed Student’s t test.
Figure 2
Figure 2. Loss of Mob1a/1b promotes tumorigenesis.
(A and B) Tumor types arising in Mob1aΔ/Δ1btr/+ or Mob1aΔ/+1btr/tr mice. (A) Macroscopic or microscopic photographs of the indicated gross or H&E-stained tumors in mutant mice. Yellow arrows, tumor masses. Scale bars: 100 μm. (B) Kaplan-Meier analysis of tumor onset and survival for the Mob1aΔ/Δ1btr/+ (n = 31), Mob1aΔ/+1btr/tr (n = 48), and control Mob1aΔ/+1btr/+ (n = 22) mice in A. (C) Southern blots of tumor DNA showing loss of the WT Mob1 allele. Top (hybridized to probe A of Supplemental Figure 1A): lanes 1–3, control thymic DNA from Mob1a+/+, Mob1aΔ/+, and Mob1aΔ/Δ mice, respectively; lanes 4–5, osteosarcomas; 6–7, fibrosarcomas; 8–9, skin cancers; 10–11, breast cancers; 12–13, salivary gland cancers of Mob1aΔ/+1btr/tr mice. Bottom (probe C): 1–3, control tail DNA of Mob1b+/+, Mob1btr/+, and Mob1btr/tr mice, respectively; 4–5, osteosarcomas; 6–7, fibromyosarcomas; 8–9, skin cancers; 10–11, liver cancers of Mob1aΔ/Δ1btr/+ mice. Results shown are representative of at least 3 independent trials and at least 3 mice/group. Data are presented as the mean ± SEM, and P values were determined using the 2-tailed Student’s t test.
Figure 3
Figure 3. Characterization of keratinocyte-specific Mob1a/1b double-homozygous mutant mice.
(AC) Features of 16-day-old Krt14CreERMob1afl/fl1btr/tr mice that were originally left untreated (control) or treated with tamoxifen (kDKO) at P1. (A) kDKO(P1) mice have a wrinkled-bear facial appearance (top left), ruffled, shaggy body hair (bottom left), abnormally large front paws (top right), and decreased survival (bottom right). (B) H&E-stained longitudinal and transverse sections of the back skin of the mice in A. kDKO(P1) mice show hyperplasia of IFE and HF. Scale bars: 50 μm. (C) kDKO(P1) mice show parakeratosis (reduced enucleation) in stratum corneum layers. Scale bar: 20 μm. (D) Immunohistochemical analyses of fat pad epidermis of the mice in A using Alexa Fluor 488–tagged Abs recognizing the indicated differentiation markers corresponding to a specific skin layer. DAPI, nuclei. Scale bar: 50 μm. (E) Immunohistochemical analyses of back skin of the mice in A using Abs recognizing the indicated skin layer markers. For top panels, cells were stained with Alexa Fluor 568–tagged anti-KRT14 Ab. DAPI, nuclei. Scale bars: 20 μm. For bottom panels, cells were stained with Alexa Fluor 488–tagged anti-Trichohyalin Ab and Fluor 568–tagged anti-KRT17 Ab. Scale bar: 50 μm. (F) H&E-stained longitudinal sections of skin from 42-day-old Krt14CreERMob1afl/fl1btr/tr mice that were left untreated (control) or treated with tamoxifen (kDKO) at P28. The kDKO(P28) mutant shows hyperplasia of IFE and HFs. Scale bar: 200 μm. Results shown are representative of at least 3 independent trials and at least 3 mice/group. Data are presented as the mean ± SEM.
Figure 4
Figure 4. Tumorigenic anomalies in Mob1a/1b double-homozygous mutant keratinocytes.
(A) Anti-Ki67 immunostaining of IFE (left) and HF (middle) of control and kDKO(P1) mice at P13. Scale bars: 50 μm. Quantitation of Ki67+ cells (right); *P < 0.01. (B) Histology (left) and quantitation (right) of TUNEL-stained cells in epidermis from control and kDKO(P1) mice at P16. Scale bar: 50 μm; *P < 0.01. (C) Keratinocytes from control and kDKO(P1) mice at P4 were cultured for the indicated number of days, and total cell numbers were counted. kDKO(P1) keratinocytes achieved higher saturation plating density; *P < 0.01. (D) Left: H&E-stained epidermal basal layer of control and kDKO(P1) mice at P19. Scale bar: 20 μm. Right: quantitation (cell number/50 εm BM); n = 5/group; *P < 0.05. (EG) Immunostaining to detect γ-Tubulin (green) and α-Tubulin (red) in control and kDKO(P1) keratinocytes. DAPI, nuclei. Mutant keratinocytes showed excess centrosomes (E), multi-polar spindles (F), and micronuclei (G). Scale bars: 20 μm; *P < 0.05. (H) Identification of keratinocyte stem cells in HFs of control and kDKO(P1) mice at P19 (n = 4/group) using quantitative RT-PCR (left), *P < 0.01; flow cytometry (middle) to detect CD34; immunostaining (right) to detect SOX9. Scale bar: 100 μm. (I) Freshly isolated control and kDKO(P1) keratinocytes were plated to generate primary colonies (left) and secondary colonies (right). Giemsa staining (top) and colony counts (bottom) were performed on day 14 after plating; n = 4/group;*P < 0.02. Results shown are representative of at least 3 independent trials and at least 3 mice/group. Data are presented as the mean ± SEM, and P values were determined using the 2-tailed Student’s t test.
Figure 5
Figure 5. MOB1-mediated regulation of the LATS1/2-YAP1 pathway controls skin homeostasis.
(A) Immunostaining of keratinocytes from control and kDKO(P1) mice at P19 to detect YAP1 in the IFE (top) and HF (bottom). Scale bar: 50 μm. (B) Immunoblot of total extracts of control and kDKO(P1) keratinocytes to detect the indicated proteins. α-Tubulin, loading control. (C) Immunoblot of cytoplasmic and nuclear fractions of control and kDKO(P1) keratinocytes to detect the indicated proteins. α-Tubulin and Lamin, cytoplasmic and nuclear loading controls, respectively. (D) Immunostaining to detect YAP1 in keratinocytes from control and kDKO(P1) mice plated at low or high cell density. YAP1 is localized in the nucleus in mutant keratinocytes even at high cell density. (E) Immunoblot to detect the indicated proteins in total extracts of control (Cont) and kDKO(P1) keratinocytes that were left untreated (OA–) or treated with OA (OA+). Left: unadjusted lysates. Right: levels of LATS1 and LATS2 proteins in each sample were adjusted to equality before electrophoresis. Results shown are representative of at least 3 independent trials and at least 3 mice/group.
Figure 6
Figure 6. Characterization of skin cancers of Mob1-deficient mice and human trichilemmal carcinomas.
(A) H&E-stained sections of representative tumors from Mob1aΔ/Δ1btr/+ or Mob1aΔ/+1btr/tr mice showing: (top left) characteristic trichilemmal keratinization (yellow arrows; also in right); (bottom left) atypical and highly mitotic cells; and (right) continuity with the epidermis. Scale bars: 50 μm (left); 500 μm (right). (B) Immunostaining of tumors from Mob1aΔ/Δ1btr/+ or Mob1aΔ/+1btr/tr mice to detect the indicated skin markers. White arrows, cancerous lesions; yellow arrow, nontumorous HF. Scale bar: 200 μm. (C) Immunoblot of total extracts of control and kDKO(P1) keratinocytes to detect ERK and AKT activation as well as the HF morphogenesis proteins GLI2 (FL; full length), LEF1 and HES1. β-Actin, loading control. (D) Immunostaining to detect GLI2 in HFs from control or kDKO(P1) mice. Scale bar: 25 μm. (E) Immunoblot to detect GLI2 in total extracts of control keratinocytes transfected with scramble siRNA (Control siSc) or Gli2 siRNA (Control siGli2), as well as in samples of 4 trichilemmal carcinomas (Tumor 1, 2, 3, 4) from kDKO(P1) mice. (F) H&E staining of a human trichilemmal carcinoma viewed at low (scale bar: 200 μm) or high magnification (scale bar: 50 μm). (G) Immunostaining to detect YAP1 and MOB1A/1B in human trichilemmal carcinomas and nearby noncancerous tissues. Top: Both noncancerous and trichilemmal carcinoma (T) tissues can be seen in low-magnification images. Bottom: High-magnification images of human trichilemmal carcinomas. Scale bars: 100 μm. Results shown are representative of at least 3 independent trials and at least 3 mice/group.

References

    1. Blanpain C, Horsley V, Fuchs E. Epithelial stem cells: turning over new leaves. Cell. 2007;128(3):445–458. doi: 10.1016/j.cell.2007.01.014. - DOI - PMC - PubMed
    1. Reya T, Morrison SJ, Clarke MF, Weissman IL. Stem cells, cancer, and cancer stem cells. Nature. 2001;414(6859):105–111. doi: 10.1038/35102167. - DOI - PubMed
    1. Headington JT. Tumors of the hair follicle. A review. Am J Pathol. 1976;85(2):479–514. - PMC - PubMed
    1. Fan H, Oro AE, Scott MP, Khavari PA. Induction of basal cell carcinoma features in transgenic human skin expressing Sonic Hedgehog. Nat Med. 1997;3(7):788–792. - PubMed
    1. Oro AE, Higgins KM, Hu Z, Bonifas JM, Epstein EH, Jr, Scott MP. Basal cell carcinomas in mice overexpressing sonic hedgehog. Science. 1997;276(5313):817–821. doi: 10.1126/science.276.5313.817. - DOI - PubMed

Publication types

MeSH terms