. 2012 Dec;122(12):4621-34.
doi: 10.1172/JCI62973. Epub 2012 Nov 12.

ER stress-mediated autophagy promotes Myc-dependent transformation and tumor growth

Affiliations

ER stress-mediated autophagy promotes Myc-dependent transformation and tumor growth

Lori S Hart et al. J Clin Invest. 2012 Dec.

Abstract

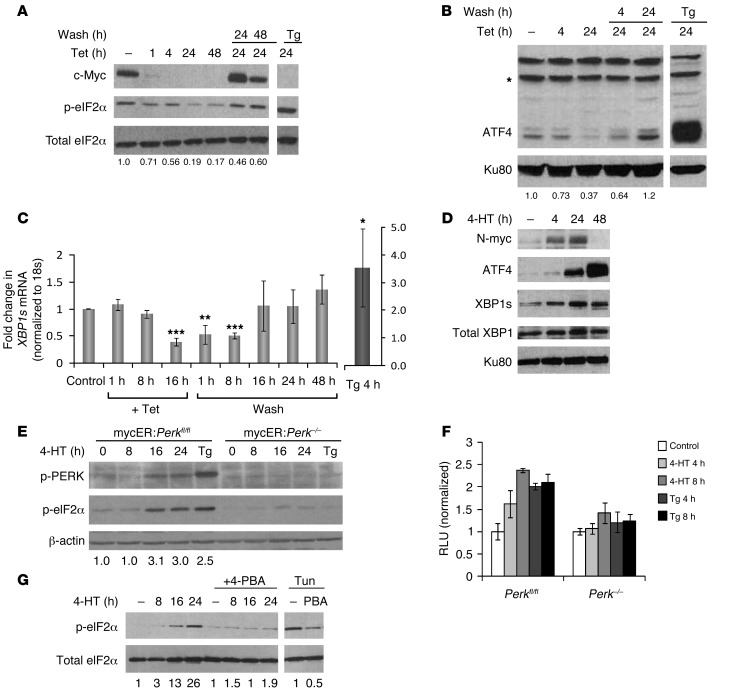
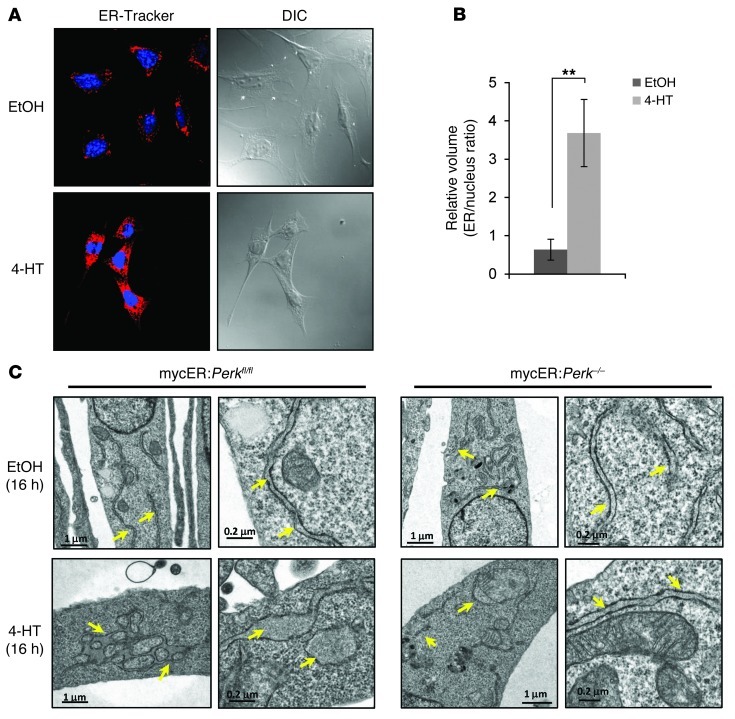
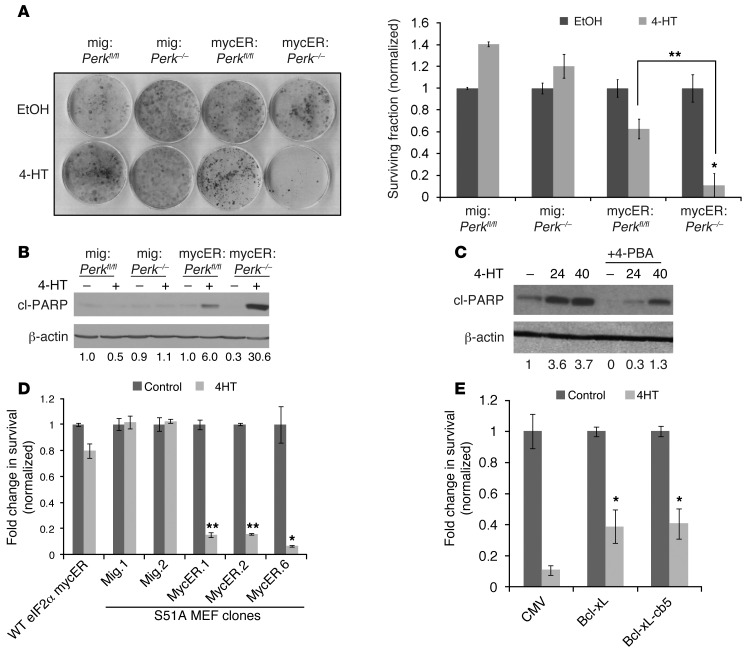
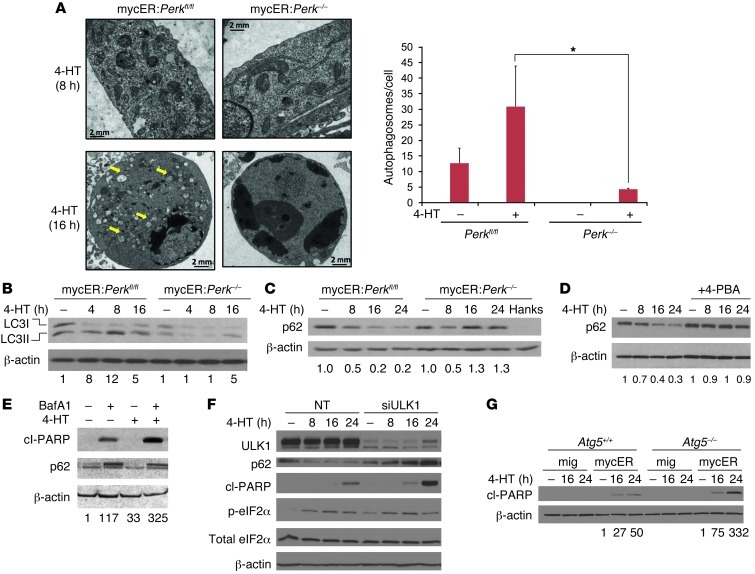
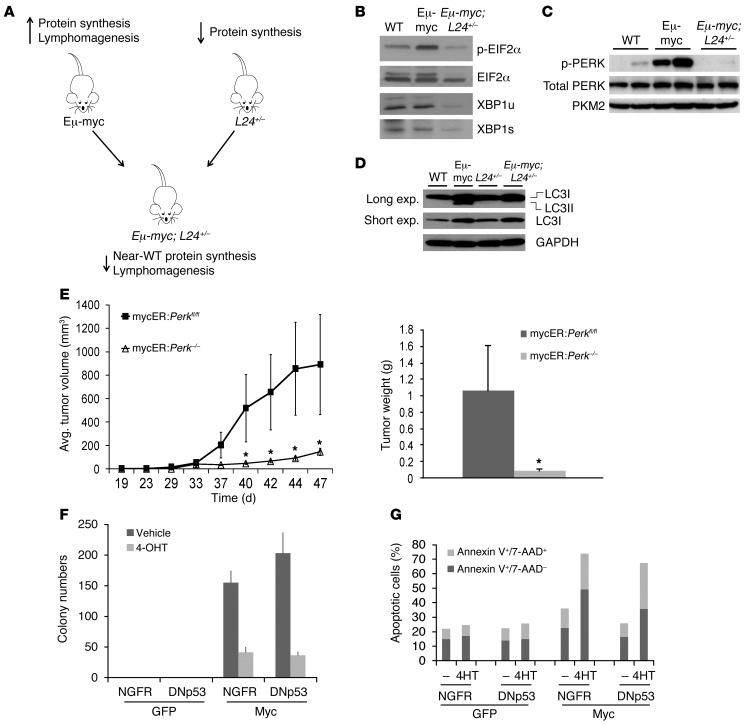
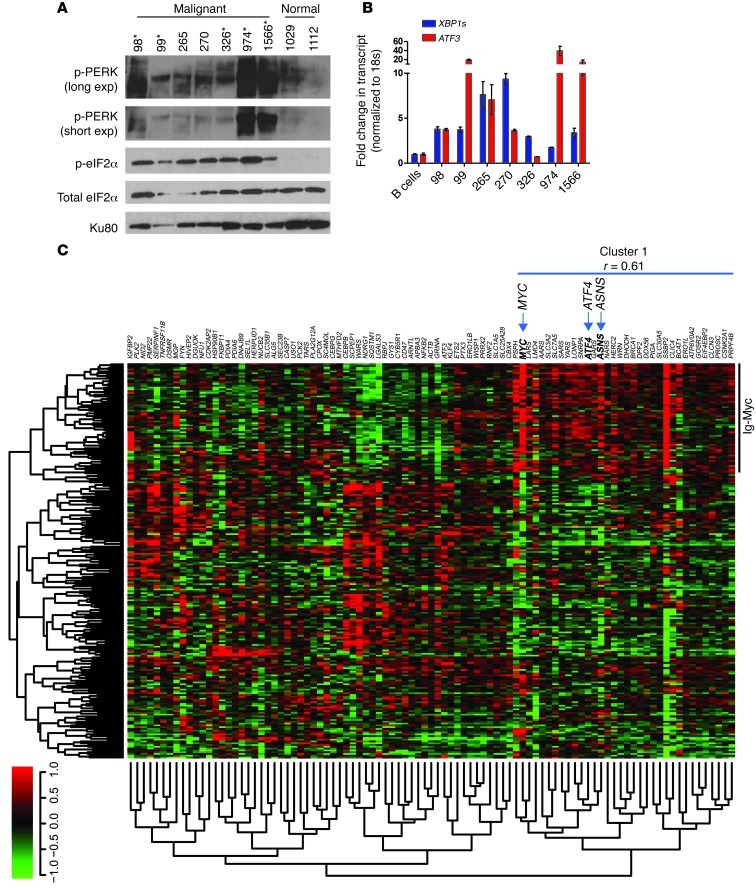
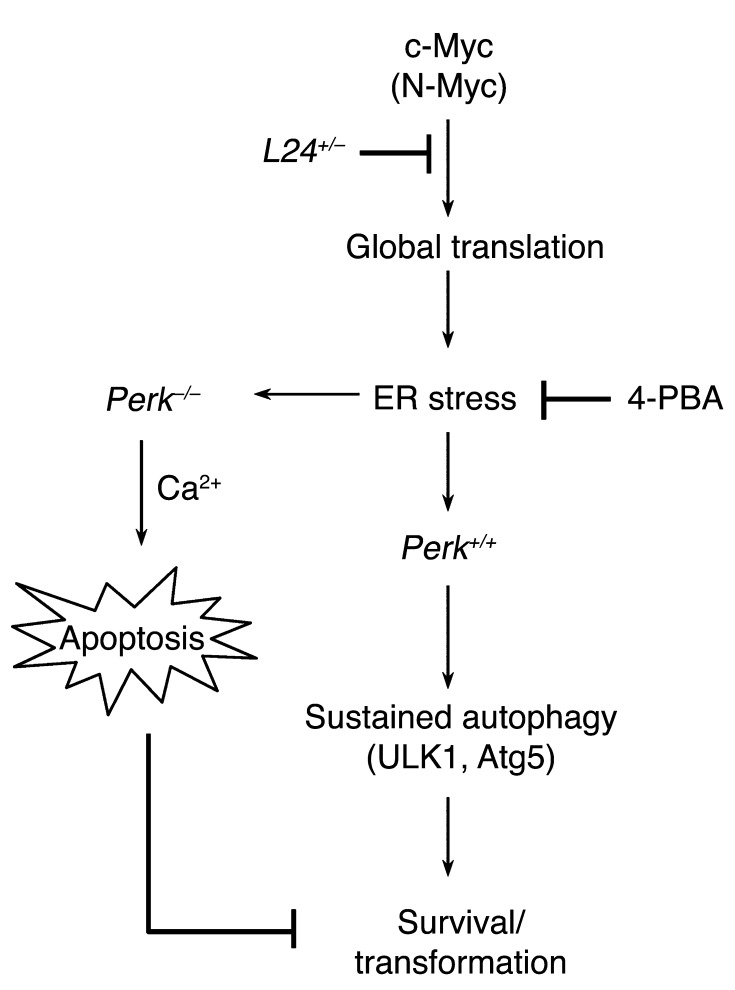
The proto-oncogene c-Myc paradoxically activates both proliferation and apoptosis. In the pathogenic state, c-Myc-induced apoptosis is bypassed via a critical, yet poorly understood escape mechanism that promotes cellular transformation and tumorigenesis. The accumulation of unfolded proteins in the ER initiates a cellular stress program termed the unfolded protein response (UPR) to support cell survival. Analysis of spontaneous mouse and human lymphomas demonstrated significantly higher levels of UPR activation compared with normal tissues. Using multiple genetic models, we demonstrated that c-Myc and N-Myc activated the PERK/eIF2α/ATF4 arm of the UPR, leading to increased cell survival via the induction of cytoprotective autophagy. Inhibition of PERK significantly reduced Myc-induced autophagy, colony formation, and tumor formation. Moreover, pharmacologic or genetic inhibition of autophagy resulted in increased Myc-dependent apoptosis. Mechanistically, we demonstrated an important link between Myc-dependent increases in protein synthesis and UPR activation. Specifically, by employing a mouse minute (L24+/-) mutant, which resulted in wild-type levels of protein synthesis and attenuation of Myc-induced lymphomagenesis, we showed that Myc-induced UPR activation was reversed. Our findings establish a role for UPR as an enhancer of c-Myc-induced transformation and suggest that UPR inhibition may be particularly effective against malignancies characterized by c-Myc overexpression.


Figures

Figure 1
Figure 1. c-Myc–induced UPR activation in P493-6 human lymphoma cells and immortalized MEFs.
(A and B) P493-6 B cells expressing Tet-repressible c-Myc were treated with tetracycline (Tet) or thapsigargin (Tg) and (A) c-Myc and phosphorylated eIF2α (S51) and (B) nuclear ATF4 protein levels were analyzed (immunoblots are representative of more than 3 independent experiments; *nonspecific bands on ATF4 immunoblot). Lanes were run on the same gel but were noncontiguous. Wash refers to the time (h) following removal of tetracycline and continued culturing in tet-free media. (C) qPCR of mRNA levels of the UPR target XBP1s. Values were normalized to 18s rRNA and expressed as fold change relative to control (Tet-free) conditions (n = 3 independent experiments; ***P < 0.003, **P < 0.04, *P < 0.05, Student’s 2-tailed t test). Scale on the right refers to Tg sample only. (D) SHEP N-MycER cells were treated with 4-HT to activate the nuclear translocation of N-Myc, and immunoblotting was performed for N-Myc, ATF4, and XBP1s. (E) MEFs were treated with 4-HT to activate c-Myc and p-PERK, and p-eIF2α levels were analyzed by immunoblotting. (F) MEFs expressing the 5′ UTR–ATF4–luciferase construct were treated with 4-HT for the indicated times, luciferase expression was analyzed, and results were normalized to CMV-Renilla luciferase and shown as fold change over control. (G) mycER:Perkfl/fl MEFs were treated with 4-HT or tunicamycin (Tun) in the presence or absence of 4-PBA (10 mM), and p-eIF2α levels were analyzed (representative of 2 independent experiments). Values below blots represent total pixel intensity of p-eIF2α or ATF4 normalized to the loading control for each lane and are shown as fold change over each control.
Figure 2
Figure 2. c-Myc expression induces PERK-dependent ER expansion.
(A) mycER:Perkfl/fl MEFs were treated with EtOH or 4-HT, stained with the ER-specific dye ER-Tracker, and analyzed by fluorescence confocal microscopy (cells were counterstained with DAPI; original magnification, ×400). DIC, differential interference contrast. (B) Relative ER volume (ER/nucleus) of cells stained in A. **P < 0.05, Student’s 2-tailed t test. (C) mycER:Perkfl/fl and mycER:Perk–/– MEFs were treated with 4-HT, and ER structures were examined by electron microscopy. Scale bars: 1.0 μm (2 left panels); 0.2 μm (2 right panels) for each cell line.
Figure 3
Figure 3. Loss of UPR signaling results in c-Myc–induced caspase-dependent apoptosis.
(A) Perkfl/fl or Perk–/– MEFs infected with control (mig) or mycER–expressing retroviruses were treated with EtOH or 4-HT, and clonogenic survival was assayed (left panel); colonies were counted, and the surviving fraction is presented (right panel) normalized to each untreated control (error bars represent SEM; n = 3; **P < 0.0001, *P < 0.0003). (B) MEFs were treated with 4-HT for 24 hours, followed by immunoblotting for cleaved PARP (c-PARP). (C) mycER:Perk–/– MEFs were treated with 4-HT in the presence or absence of 4-PBA (5 mM), and immunoblotting was performed for cleaved-PARP. (D) S51A-eIF2α knock-in MEFs infected with control (mig) or mycER-expressing retroviruses were treated with ethanol or 4-HT, and survival was assayed (compared with WT MEFs expressing mycER; **P < 0.00002, *P < 0.002, Student’s 2-tailed t test). (E) mycER:Perk–/– MEFs were transfected with CMV control or Bcl-xL–expressing plasmids (WT or ER-targeted cb5), treated with 4-HT, cultured for 72 hours, and stained with crystal violet, and cell survival was quantified (*P < 0.001, Student’s 2-tailed t test).
Figure 4
Figure 4. PERK-dependent autophagy promotes cell survival in cells expressing c-Myc.
(A) MEFs were treated with 4-HT, then analyzed for autophagosome formation by electron microscopy (left panel; scale bars: 2 μm), and autophagosomes were quantified (right panel: 3–8 cells per treatment; *P < 0.05, 1-tailed Student’s t test). (B) MEFs were treated with 4-HT and analyzed for processing of the autophagic marker LC3 with immunoblotting (blots are representative of 3 independent experiments; values represent the ratio of LC3II to LC3I and are shown as fold change relative control). (C) MEFs were treated with 4-HT, and immunoblotting was performed for degradation of p62 (Hanks solution used as positive control). (D) mycER:Perkfl/fl MEFs were treated with 4-HT in the presence or absence of 4-PBA, and immunoblotting was performed for p62. (E) mycER:Perkfl/fl MEFs were treated with bafilomycin A1 (BafA1; 50 nM) and 4-HT, and cleaved PARP and p62 levels were analyzed. (F) mycER:Perkfl/fl MEFs were transfected with non-targeting (NT) or ULK1 siRNA, treated with 4-HT, and analyzed for autophagy and apoptosis. (G) Atg5+/+ and Atg5–/– MEFs were infected with control (mig) or mycER retrovirus and treated with 4-HT to detect cleaved PARP (β-actin was used as a loading control; representative of 2 independent experiments; values below blot represent total pixel intensity of cleaved PARP normalized to actin for each lane and are shown as fold change relative to no tetracycline control).
Figure 5
Figure 5. In vivo activation of the UPR in Eμ-myc transgenic mice and Myc-expressing murine HPCs.
(A) Breeding scheme for the generation of Eμ-myc/+;L24+/– double transgenic mice. (B) B lymphocytes from the spleens of WT, Eμ-myc/+, and Eμ-myc/+;L24+/– transgenic mice were isolated, and immunoblot analysis was performed to detect p-eIF2α (S51), total eIF2α, and XBP1s (XBP1u, unspliced XBP1). (C) B lymphocytes from WT, Eμ-myc, and Eμ-myc/+;L24+/– mice were isolated, and immunoblot analysis was performed to detect total and phosphorylated PERK (lymphocytes from 2 mice per strain). (D) B lymphocytes from WT, Eμ-myc, and Eμ-myc/+;L24+/– mice were analyzed for LC3II processing, indicative of autophagy. exp, exposure. (E) RasV12-transformed MEFs (1 × 10⁶) were injected subcutaneously into the flanks of immunodeficient mice, and c-Myc was activated by intraperitoneal injection of tamoxifen every 2 days for the duration of the experiment. Tumor growth (left panel) and final tumor weight (right panel) measurements are shown (n = 10 tumors per group; *P < 0.04, Student’s 1-tailed t test). (F and G) HPCs from Perkfl/fl;CreER mice were isolated, infected to overexpress Myc and DN-p53, and treated with 4-HT to excise PERK; colony formation was assessed by culture in methylcellulose (F), and cell death was measured by Annexin V and 7-AAD staining (G).
Figure 6
Figure 6. UPR activation in human lymphomas.
(A) Primary human B cells, obtained from lymphoma patients and normal donors, were analyzed for UPR activation by p-eIF2α and p-PERK (Ser713) levels (*samples with Myc translocation confirmed by FISH analysis [note: Myc translocation was confirmed for patient 1566, who was diagnosed with AML]; all other samples were confirmed for Burkitt’s lymphoma morphology and are presumed to contain Myc translocations). (B) Primary human B cell samples were analyzed for downstream UPR activation by qPCR of XBP1s and ATF3 (average of 3 independent qPCR reactions). (C) An ER stress response signature clusters c-Myc–overexpressing B cell lymphomas. Raw data were downloaded from the NCBI GEO repository (GSE4475). The genes listed were derived from an ER stress response signature defined using ER stressors and genetic knockouts by Harding et al. (49). Normalized probe signals for the genes listed were clustered using a Pearson complete correlation coefficient, with a significance threshold for each hierarchical subcluster set at P < 0.05. Cases annotated as Ig-Myc were defined as such by fluorescence in situ hybridization in the original expression array study. Expression signals are depicted using pseudocoloring, in which expression for each gene is shown as high (red) or low (green).
Figure 7
Figure 7. Model of the role of UPR activation in cytoprotection during Myc-dependent transformation.
c-Myc activation increases protein synthesis, resulting in UPR activation. This is attenuated by genetically reducing protein synthesis (L24 mouse minute) or pharmacologically increasing chaperone activity (4-PBA). In the presence of PERK, cytoprotective autophagy (LC3 processing, p62 degradation) is induced and is required for cell survival (ULK1 and Atg5 dependence). Loss of PERK results in significantly increased apoptosis, primarily through increase Ca2+ release form the ER and lack of autophagy.

References

    1. Ron D, Walter P. Signal integration in the endoplasmic reticulum unfolded protein response. Nat Rev Mol Cell Biol. 2007;8(7):519–529. doi: 10.1038/nrm2199. - DOI - PubMed
    1. Malhotra JD, Kaufman RJ. The endoplasmic reticulum and the unfolded protein response. Semin Cell Dev Biol. 2007;18(6):716–731. - PMC - PubMed
    1. Yoshida H, Matsui T, Yamamoto A, Okada T, Mori K. XBP1 mRNA is induced by ATF6 and spliced by IRE1 in response to ER stress to produce a highly active transcription factor. Cell. 2001;107(7):881–891. doi: 10.1016/S0092-8674(01)00611-0. - DOI - PubMed
    1. Bertolotti A, Zhang Y, Hendershot LM, Harding HP, Ron D. Dynamic interaction of BiP and ER stress transducers in the unfolded-protein response. Nat Cell Biol. 2000;2(6):326–332. doi: 10.1038/35014014. - DOI - PubMed
    1. Haze K, Yoshida H, Yanagi H, Yura T, Mori K. Mammalian transcription factor ATF6 is synthesized as a transmembrane protein and activated by proteolysis in response to endoplasmic reticulum stress. Mol Biol Cell. 1999;10(11):3787–3799. - PMC - PubMed

Publication types

MeSH terms