. 2013 Nov;218(6):1513-30.
doi: 10.1007/s00429-012-0473-7. Epub 2012 Nov 13.

Interactions between the neuromodulatory systems and the amygdala: exploratory survey using the Allen Mouse Brain Atlas

Affiliations

Interactions between the neuromodulatory systems and the amygdala: exploratory survey using the Allen Mouse Brain Atlas

Andrew Zaldivar et al. Brain Struct Funct. 2013 Nov.

Abstract

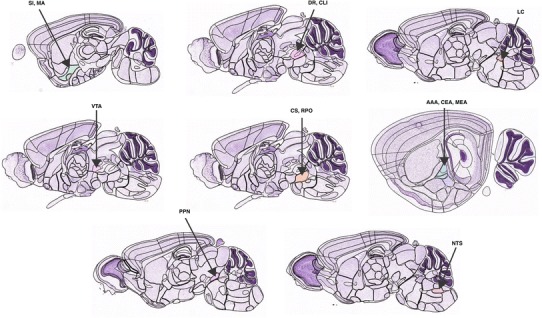
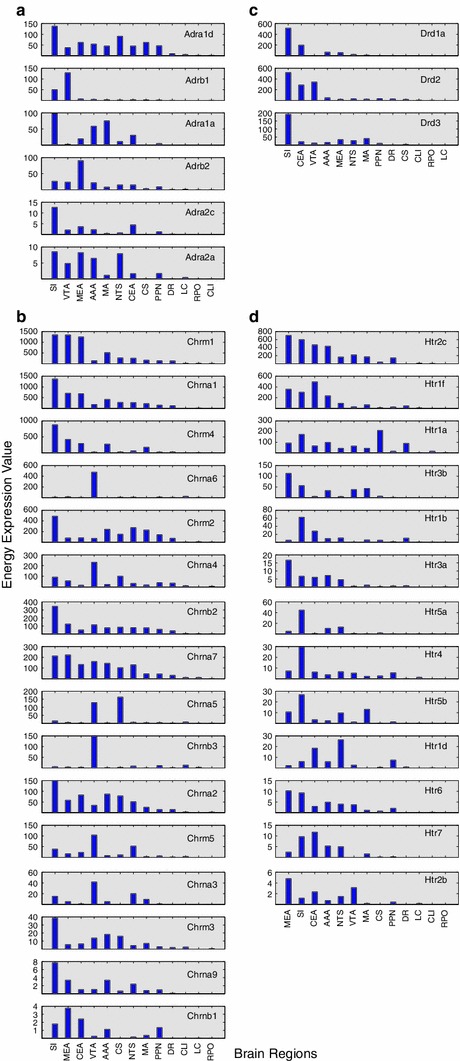
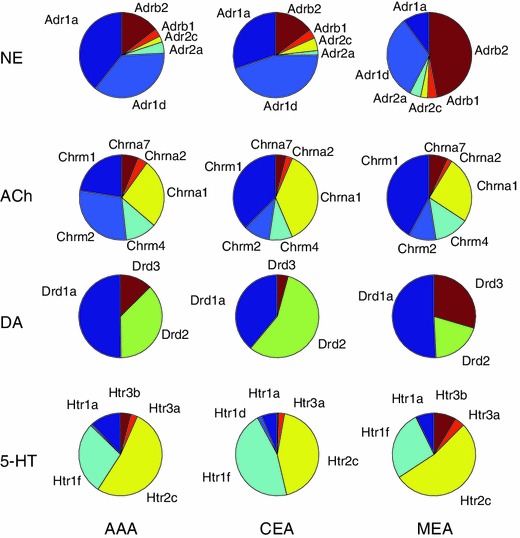
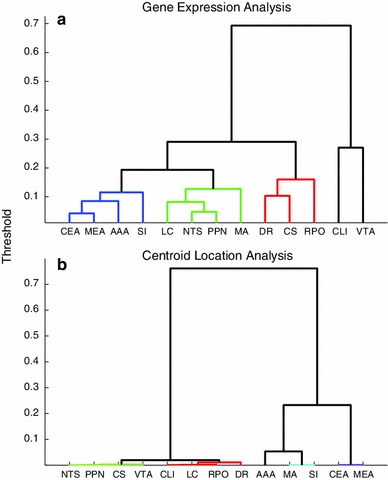
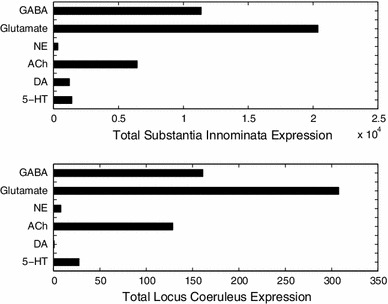
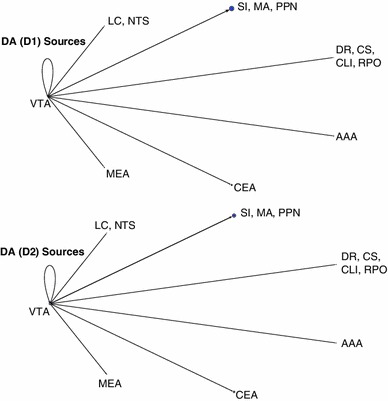
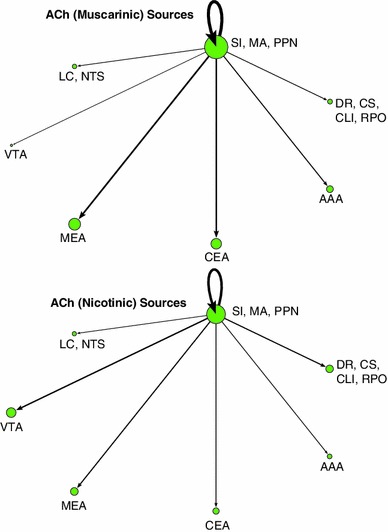
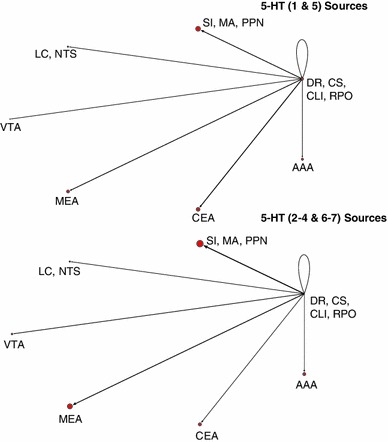
Neuromodulatory systems originate in nuclei localized in the subcortical region of the brain and control fundamental behaviors by interacting with many areas of the central nervous system. An exploratory survey of the cholinergic, dopaminergic, noradrenergic, and serotonergic receptor expression energy in the amygdala, and in the neuromodulatory areas themselves was undertaken using the Allen Mouse Brain Atlas. The amygdala was chosen because of its importance in cognitive behavior and its bidirectional interaction with the neuromodulatory systems. The gene expression data of 38 neuromodulatory receptor subtypes were examined across 13 brain regions. The substantia innominata of the basal forebrain and regions of the amygdala had the highest amount of receptor expression energy for all four neuromodulatory systems examined. The ventral tegmental area also displayed high receptor expression of all four neuromodulators. In contrast, the locus coeruleus displayed low receptor expression energy overall. In general, cholinergic receptor expression was an order of magnitude greater than other neuromodulatory receptors. Since the nuclei of these neuromodulatory systems are thought to be the source of specific neurotransmitters, the projections from these nuclei to target regions may be inferred by receptor expression energy. The comprehensive analysis revealed many connectivity relations and receptor localization that had not been previously reported. The methodology presented here may be applied to other neural systems with similar characteristics, and to other animal models as these brain atlases become available.


Figures

Fig. 1
Fig. 1
Image of reference atlas highlighting brain regions examined in the survey of neuromodulatory genes using the Allen Mouse Brain Atlas dataset. Brain regions studied include: dorsal raphe nucleus (DR), superior central nucleus raphe (CS), central linear nucleus raphe (CLI), nucleus raphe pontis (RPO), ventral tegmental area (VTA), locus coeruleus (LC), nucleus of the solitary tract (NTS), substantia innominata (SI), magnocellular nucleus (MA), pedunculopontine nucleus (PPN), anterior amygdalar area (AAA), central amygdalar nucleus (CEA) and medial amygdala nucleus (MEA). Image originally from the Allen Mouse Brain Reference Atlas (http://mouse.brain-map.org/static/atlas)
Fig. 2
Fig. 2
Total expression energy per brain region when combining all subtypes. Gene expression values for each subtype were collapsed into their respective neuromodulatory systems and separated by brain region. Brain regions were arranged from most (top) to least (bottom) amount of total expression
Fig. 3
Fig. 3
Expression of individual receptor subtypes across all neuromodulatory systems. Charts were grouped by neuromodulatory systems; a adrenergic, b cholinergic, c dopaminergic, and d serotonergic. Subtypes within each system were arranged from most (left) to least (right) amount of expression along the x-axis. Brain regions were ordered from most (top) to least (bottom) amount of total expression energy for each neuromodulator. The y-axis shows the expression energy for a given gene. Note that the y-axis scale varies for visualization purposes
Fig. 4
Fig. 4
Distribution of gene expression within the different amygdala areas. Each column represents a different amygdala region (AAA Anterior amygdalar area, CEA central amygdalar area, MEA medial amygdalar area). Each row represents the distribution of expression for a particular neuromodulatory system. The amount of gene expression is relative to the slice size in each pie chart
Fig. 5
Fig. 5
Hierarchical cluster of gene expression and location of brain region. a The dendrogram was derived from the expression of selected genes. b The dendrogram was derived from the xyz coordinates of brain area centroid given in the reference atlas. The dendrograms were generated using a Euclidean distance metric. The cutoff for generating the different clusters was set to 0.19 for (a) and 0.02 for (b), which broke the hierarchical cluster into four separate constitutes, denoted by their different coloring scheme
Fig. 6
Fig. 6
Total expression energy for GABA, glutamate, and neuromodulatory receptors across the substantia innominata (top) and locus coeruleus (bottom). Expression energy from neuromodulatory receptors is the same as in Fig. 2
Fig. 7
Fig. 7
Network model showing overall expression of neuromodulatory receptors and their implied neuromodulatory projections to target areas. Vertices represent brain regions that are either standalone (AAA, CEA, MEA) or are combined regions (sources of neuromodulators). Directed arcs represent projections going to and coming from a source. The pointed-arrow indicates the target location and the non-arrow end of the arc indicates the origin. The thickness of each arc, as well as the size of vertices, is proportional to the amount of expression found in the target location. Colors were used for visualization purposes, similar to Figs. 2 and 3
Fig. 8
Fig. 8
Network model comparison between the expression energy of α and β adrenergic receptors
Fig. 9
Fig. 9
Network model comparison between the expression energy of muscarinic and nicotinic cholinergic receptors
Fig. 10
Fig. 10
Network model comparison between the expression energy of D1 and D2 family dopamine receptors
Fig. 11
Fig. 11
Network model comparison between the expression energy serotonin receptors that produce an inhibitory response (Htr1 and HTR5) and serotonin receptors that produce an excitatory response (Htr2, Htr3, Htr4, Htr6 and Htr7)

Similar articles

Cited by

References

    1. Barnes N, Sharp T. A review of central 5-HT receptors and their function. Neuropharmacology. 1999;38(8):1083–1152. - PubMed
    1. Batagelj V, Mrvar A. Pajek-program for large network analysis. Connections. 1998;21(2):47–57.
    1. Baxter MG, Chiba AA. Cognitive functions of the basal forebrain. Curr Opin Neurobiol. 1999;9(2):178–183. - PubMed
    1. Berridge CW, Waterhouse BD. The locus coeruleus-noradrenergic system: modulation of behavioral state and state-dependent cognitive processes. Brain Res Rev. 2003;42(1):33–84. - PubMed
    1. Bhatia SC, Saha S, Manchanda SK, Nayar U. Role of midbrain ventro-lateral tegmental area (VTA) adrenergic mechanisms in facilitation of hypothalamically-induced predatory attack behaviour. Indian J Exp Biol. 1997;35(4):332–337. - PubMed

Publication types

Substances