

doi: 10.1038/nn.3263.
Epub 2012 Nov 11.
Impaired adult myelination in the prefrontal cortex of socially isolated mice
Affiliations
- PMID: 23143512
- PMCID: PMC3729624
- DOI: 10.1038/nn.3263
Item in Clipboard
Impaired adult myelination in the prefrontal cortex of socially isolated mice
Nat Neurosci.
2012 Dec.
Abstract
Protracted social isolation of adult mice induced behavioral, transcriptional and ultrastructural changes in oligodendrocytes of the prefrontal cortex (PFC) and impaired adult myelination. Social re-integration was sufficient to normalize behavioral and transcriptional changes. Short periods of isolation affected chromatin and myelin, but did not induce behavioral changes. Thus, myelinating oligodendrocytes in the adult PFC respond to social interaction with chromatin changes, suggesting that myelination acts as a form of adult plasticity.
Figures

Prolonged social isolation of adult mice induces hypomyelination in PFC. (a) Electron micrographs of axons in the PFC, nucleus accumbens (NAc) and corpus callosum (CC) from control and isolated mice. Scale bar, 0.5 μm. (b) Scatter plot of g ratio values in the PFC in group-housed controls (n = 315 axons) and isolated (n = 321 axons) mice. (c) Electron micrograph of axons in the cerebellum (CBM) from isolated and control mice. Scale bar, 0.5 μm. (d) Scatter plot showing g ratio values in the CBM of control (n = 239) and isolated (n = 290 axons) mice.

Prolonged social isolation of adult mice decreases myelin gene products and heterochromatin formation. (a,b) Quantitative real-time-PCR (qRT-PCR) of myelin gene transcripts in nucleus accumbens, corpus callosum and PFC. Bar graphs indicate average values in six isolated mice after Gapdh normalization relative to average control levels (dashed line) (*false discovery rate (FDR) < 0.05, **FDR < 0.01). (c) Confocal images of Mbp+ (red) myelinated fibers in PFC and cerebellum. DAPI (blue) was used as nuclear counterstain. Scale bar, 10 μm. (d) Confocal images of oligodendrocytes in the PFC of isolated and group-housed Cnp-EGFP mice. (e) Electron micrographs of PFC showing myelinated axon (top) and relative appearance of oligodendrocyte nuclei (bottom) in isolated and control mice. Scale bar, 1 μm. (f) Scatter plot of the percentage nuclear heterochromatin in PFC oligodendrocytes from control (n = 36 nuclei) and isolated (n = 40 nuclei) mice (***P < 0.001). (g,h) Confocal images of CC1+ oligodendrocytes (green) colabeled with antibodies for acetylated histone marks (H3ac, red, g) or repressive methylation marks (H3K9me3, red, h). Scale bars, 10 μm. (i,j) qRT-PCR analysis of transcripts of enzymes regulating histone acetylation (i) and repressive DNA and histone methylation (j). Data are presented as in a and b. Error bars, s.e.m.
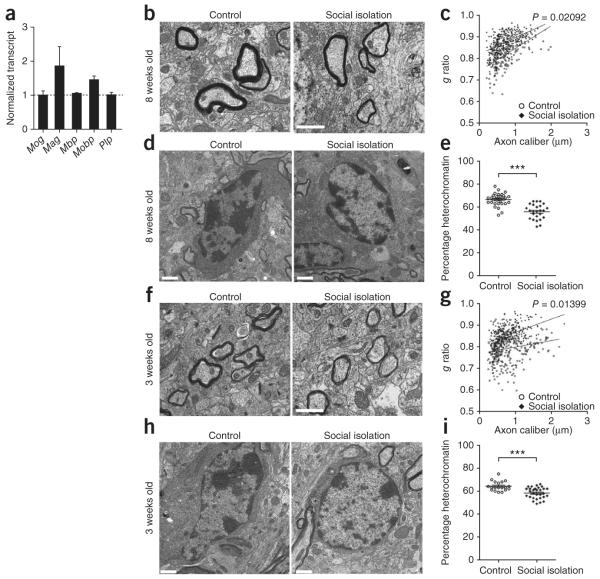
Short-term isolation is sufficient to induce chromatin changes and reduce myelin thickness in both adult and juvenile mice. (a) qRT-PCR of myelin transcripts in the PFC of adult (8 week old) mice after 2 weeks of social isolation. Bar graphs indicate average values for isolated mice after Gapdh normalization and are presented as relative values to average control levels (dashed line). (b,f) Electron micrographs of axons in PFC of adult (b) and juvenile (f) mice after 2 weeks of social isolation. Scale bars, 1 μm. (c) Scatter plot of g ratio values in adult PFC of isolated (n = 279 axons) and control (n = 200 axons) mice. (d,h) Electron micrographs of oligodendrocyte nuclei in PFC of adult (d) and juvenile (h) mice in control housing or isolated for 2 weeks. Scale bars, 1 μm. (e,i) Scatter plot of the percentage of nuclear heterochromatin in PFC oligodendrocytes in adult (e) isolated (n = 40 nuclei) and control (n = 36 nuclei) mice and juvenile (i) isolated (n = 30 nuclei) and control (n = 19 nuclei) mice. (g) Scatter plot of g ratio values in juvenile PFC of isolated (n = 248 axons) and control (n = 333 axons) mice. ***P < 0.001. Error bars, s.e.m.
References
Publication types
MeSH terms
Grants and funding
LinkOut - more resources
Full Text Sources
Other Literature Sources
Miscellaneous
