. 2013 Jan;16(1):64-70.
doi: 10.1038/nn.3269. Epub 2012 Nov 7.

Closed-loop optogenetic control of thalamus as a tool for interrupting seizures after cortical injury

Affiliations

Closed-loop optogenetic control of thalamus as a tool for interrupting seizures after cortical injury

Jeanne T Paz et al. Nat Neurosci. 2013 Jan.

Abstract

Cerebrocortical injuries such as stroke are a major source of disability. Maladaptive consequences can result from post-injury local reorganization of cortical circuits. For example, epilepsy is a common sequela of cortical stroke, but the mechanisms responsible for seizures following cortical injuries remain unknown. In addition to local reorganization, long-range, extra-cortical connections might be critical for seizure maintenance. In rats, we found that the thalamus, a structure that is remote from, but connected to, the injured cortex, was required to maintain cortical seizures. Thalamocortical neurons connected to the injured epileptic cortex underwent changes in HCN channel expression and became hyperexcitable. Targeting these neurons with a closed-loop optogenetic strategy revealed that reducing their activity in real-time was sufficient to immediately interrupt electrographic and behavioral seizures. This approach is of therapeutic interest for intractable epilepsy, as it spares cortical function between seizures, in contrast with existing treatments, such as surgical lesioning or drugs.


Figures

Figure 1
Figure 1. Cortical stroke results in enhanced intrinsic excitability in TC neurons
a, Confocal image of a horizontal thalamic slice ipsilateral to the stroke (7 days post-stroke) with GFAP immunolabeling and thalamic neurons labeled by intracellular injection of biocytin (green, see arrows) during recordings. Pink traces: responses to intra-cellular injection of current pulses (from −200 pA to +80 pA) in TC cells from different thalamic nuclei ipsilateral to the infarct. White traces: responses from TC cells in control rats using the same protocols from corresponding nuclei. b–c, Representative voltage responses to current injections in TC cells from an injured and a control rat. Note the enhanced intrinsic rebound properties in injured cells (arrowheads: larger post-inhibitory after-depolarization, enhanced hyperpolarization-activated sag and post-hyperpolarization burst). d, Confocal images of representative control and injured TC neurons (7 days post-stroke). e, Passive membrane properties: capacitance (Cm), input resistsance (Rin) and membrane time constant (τm) in TC cells within or far (>200µm) from gliosis at 2 days, 7–14 days and >1 month post-stroke (mean ± s.e.m.; *p<0.05; ns, p>0.1; one-way ANOVA). Number of cells is indicated for each group. Data are from 9 control and 12 injured rats. AP, action potential; IC, internal capsule; nRT, Po, VL, VPL, VPM: reticular, posterior, ventrolateral, ventroposterolateral and ventroposteromedial thalamic nuclei.
Figure 2
Figure 2. Cortical stroke alters biophysical properties of Ih in TC neurons
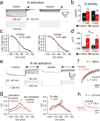
a–d, Ih activation. a, Current responses (top traces) to voltage steps (bottom traces) in representative TC cells from an injured and a control rat. Ih was measured at the tail current (arrowheads) (see Methods for details). b, The density of Ih at maximal activation was similar (ns, p>0.1) in TC cells from injured and control rats at both 7–14d and at >1mo. Post-stroke. c, Ih voltage-dependent activation curves 7–14d post-stroke: average plot of normalized Ih amplitude as a function of membrane potential, best fitted with a Boltzmann function (R2=0.99, both fits). d, Half-activation voltage (V50%) of Ih was shifted towards depolarized values after injury (*p<0.05; ***p=0.001). e, Ih de-activation protocol. Voltage-dependence of Ih de-activation was examined by fully activating Ih at −125mV and then stepping to membrane potentials between −105 and −60mV. De-activation time constant (τD) was calculated from exponential fits performed on the traces indicated by double-ended arrows. f, expanded de-activation currents traces obtained at −95mV voltage step from the cells depicted in e. g, Time constants of Ih activation and de-activation from the two representative cells (g, left) and averaged across all the cells (g, right). h, Ih activation currents during −130mV voltage step (from cells in a) were best fitted with a single-exponential function (grey lines). b,c,d,g: Data are from 5 control and 3 injured rats. a,e,f,g are from the same representative control and injured cells. The number of cells is indicated in the panels. Quantitative data: mean ± s.e.m. Statistical significance: one-way ANOVA.
Figure 3
Figure 3. Intra-thalamic network is hyperexcitable and generates epileptiform oscillations in injured animals and in a model
a top: Multiunit recordings in thalamic slices ipsilateral to cortical stroke depicting network oscillations evoked by single electrical shocks (arrowheads) to internal capsule. Inset: box charts of oscillation duration from 3 control rats (n=5 slices) and 3 injured rats (n=8 slices); one-way ANOVA. a bottom: Representative spontaneous activities. Red box: recording enlarged on the bottom trace. Note the crescendo, decrescendo pattern of the oscillation (dots and arrows). b–e, Results from computational modeling. b, (top) Minimal thalamus model including a TC neuron, negative feedback through RT neurons (gGABA) and a constant steady state cortical input current (Iinj). (bottom) Changes in intrinsic excitability (“Ih+area”: altered activation of both Ih and membrane area) promote epileptiform TC response in the network. c, The map of oscillation duration as a function of the RT-TC feedback (gGABA) and the injected input current (Iinj) indicates that, in injured conditions, a larger hyperpolarizing current (Iinj) is required to prevent the initiation of oscillations. In the text “threshold for oscillation initiation” refers to the threshold value of Iinj above which an oscillation is initiated. d, Difference in threshold for oscillation initiation between control and different injured conditions: Δθ (Ih+area) (solid red) when combining altered area and altered Ih activation; or Δθ(Ih)+Δθ(area) (dashed line) when adding separate effects of altered area and altered Ih activation; or following combined therapeutic conditions with modified h and leak conductances (Δθ(T/gh+gL), bluish green). “Threshold” (θ) is input current (Iinj) threshold for initiation of oscillations. e, Difference in oscillation duration between control and injured conditions as a function of gGABA within the physiological range of resting membrane potential (dashed lines). Duration is increased in injured conditions (top) and restored to control level under therapeutic conditions (bottom). “Ih”: only Ih activation is altered (Fig. 2); “area”: only membrane area is altered (lower Cm: Fig. 1 and Methods). “Ih+area”: both properties are altered. See text and Supplemental Figs. 4 and 5 for details.
Figure 4
Figure 4. Cortical stroke leads to late spontaneous epileptic activities in cortex and thalamus
a, EEG wavelet spectrogram from a representative cortical channel (top trace). Vertical dashed lines indicate the onset and the end of the electrographic seizure activity. White traces represent simultaneous cortical EEG and thalamic LFP recordings, temporally aligned with the wavelet spectrogram. b, Representative 1-s-long ictal and interictal EEG recordings from the recordings depicted in a. c, Corresponding power spectra of ictal (orange) and interictal (black) EEG activities from ipsi. cx channel. Dots indicate the dominant peak frequencies during ictal periods (4–5 and 8–10 Hz). The depicted recordings were obtained 6.5 months after stroke induction from a 7.5-month old rat.
Figure 5
Figure 5. Selective optical inhibition of TC neurons interrupts ongoing epileptic seizures in awake, freely behaving animals
a, Diagram of chronic multisite optrode (CMO) implanted into somatosensory thalamus for behaving recordings/optical stimulations. Arrowheads indicate thalamic recording sites (T1–4). b, Confocal image of coronal brain section taken through the cortical lesion (red dashed line) showing Camk2α:eNPHR-expressing TC fibers terminating mainly in layer 4 (yellow arrow) from a rat sacrificed after recordings. c, Representative example of simultaneously recorded cortical EEGs and thalamic LFPs before and during 594 nm light delivery in the thalamus ipsilateral to stroke. Arrows indicate seizure onset and its interruption by light delivery in thalamus. d, Mean spectrograms of thalamic LFPs and cortical EEGs from the same rat. 594 nm light pulses were delivered in VPM at time 0. Shown are examples from all stimulations (ictal: n=19; interictal: n=4) from a single recording session ~4.2 months post-stroke, 4 months post-viral delivery in thalamus. e–f, power quantification of cortical EEGs (e) and thalamic LFPs (f) before and during light delivery in thalamus (e left: ictal: n=56 events from 3 different trials; interictal: n=8 events from 2 different trials; e right: ictal: n=6 events from 2 different trials; interictal: n=11 events from 2 different trials). e left and e right are from 2 different rats. e left and f are from the same rat. RMS (root-mean-square) power was averaged 2s before and 2s during light delivery (see Methods for details). Error bars: s.e.m.. ns, p≥0.1 (not significant); *p<0.05; **p<0.01; ***p<0.0001; Paired t-test or Signed Rank test, as appropriate. Results in c–f were obtained using light at 10 mW.
Figure 6
Figure 6. Multiunit firing of TC neurons in awake, freely behaving animals
a,b, Histograms representing the mean multiunit firing frequency of TC neurons (bin, 2 s) at the indicated times before, during and after a 20s light pulse delivery in the thalamus (594 nm, 10 mW; n=9 repetitions within a trial). a–b, Multiunit firing was recorded simultaneously at 4 thalamic locations (T1–4, see CMO diagram in Supplemental Fig. 7d). Corresponding raster plots are presented at the bottom of each histogram. Data in (a) and (b) are from two different rats: (a): a rat with eNpHR:EYFP+ TC neurons; (b): a rat with EYFP+ TC neurons, not expressing eNpHR. (a) is from a rat with no stroke; (b) is from a rat with stroke. c–d, Multiunit firing rate averaged 20 s before, 20 s during and 20 s after light illumination of the thalamus. The number of sweeps is indicated in each graph. a and c top are from the same rat. b and d top are from the same rat. Each graph in c and d is from a different rat illustrating reproducibility of light effects between rats. “Rat5” corresponds to the same rat as in Fig. 5c,d,e left, f in which thalamic illumination disrupted seizures. Data correspond to mean ± s.e.m. ns, p>0.1. *p<0.05; **p<0.01. Statistical significance: paired t-test or signed rank test, as appropriate. Only data from channels from which we were able to quantify firing are presented. Firing was not detected in all the thalamic channels.
Figure 7
Figure 7. Online detection and interruption of seizures via a 594 nm light illumination of thalamus in freely behaving animals
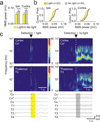
a, Upon an automatic detection of seizure activity the system randomly triggered either yellow light (yellow) or sham stimulation (grey, no light). a, RMS power of ipsi- and contra-lateral EEGs in 2 s period following seizure detection in presence of yellow light in the thalamus (n=22 events) or during sham stimulation (n=33 events). b, Corresponding cumulative probability distribution of the average RMS power with or without the light. c, Top: Representative spectrograms from a cortical EEG and a thalamic LFP in the yellow light (left) or sham (right) conditions. Bottom: corresponding recordings of cortical EEGs (Cx) and thalamic LFPs (T1–4). The spectrograms and the electrophysiological recordings are temporally (vertically) aligned. Data in c were obtained using 0.5 s - long light pulses.
Figure 8
Figure 8. Line-length calculation for real-time detection of seizures
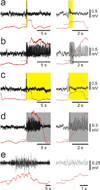
a–e, EEG recordings (Top, black traces) and their corresponding line-length (Bottom red traces) calculated in real-time using a sliding window of 2 s (see Methods for details). Line-length threshold for seizure detection was set manually at the beginning of the experiment. Upon upward crossing of the threshold (dashed line), the system randomly triggered either laser stimulation (yellow boxes) or no stimulation (grey boxes). 0.5 s- and 10 s- long 594 nm light pulses (10 mW) interrupted the seizure activity in real-time. a–d and e are from 2 different rats. Traces depicted at the left are enlarged at the right for visibility.

Comment in

References

    1. Clarkson AN, Huang BS, Macisaac SE, Mody I, Carmichael ST. Reducing excessive GABA-mediated tonic inhibition promotes functional recovery after stroke. Nature. 2010;468:305–309. - PMC - PubMed
    1. Kotila M, Waltimo O. Epilepsy After Stroke. Epilepsia. 1992;33:495–498. - PubMed
    1. Kelly KM. Animal modeling of poststroke seizures and epilepsy: 5-year update. Epilepsy Curr. 2007;7:159–162. - PMC - PubMed
    1. Lee J-C, et al. Seizures in childhood ischemic stroke in Taiwan. Brain Dev. 2009;31:294–299. - PubMed
    1. Kwan P, Brodie MJ. Early identification of refractory epilepsy. N. Engl. J. Med. 2000;342:314–319. - PubMed

Publication types

MeSH terms

Substances