. 2012 Dec;15(12):1723-8.
doi: 10.1038/nn.3261. Epub 2012 Nov 11.

Diverse types of genetic variation converge on functional gene networks involved in schizophrenia

Affiliations

Diverse types of genetic variation converge on functional gene networks involved in schizophrenia

Sarah R Gilman et al. Nat Neurosci. 2012 Dec.

Abstract

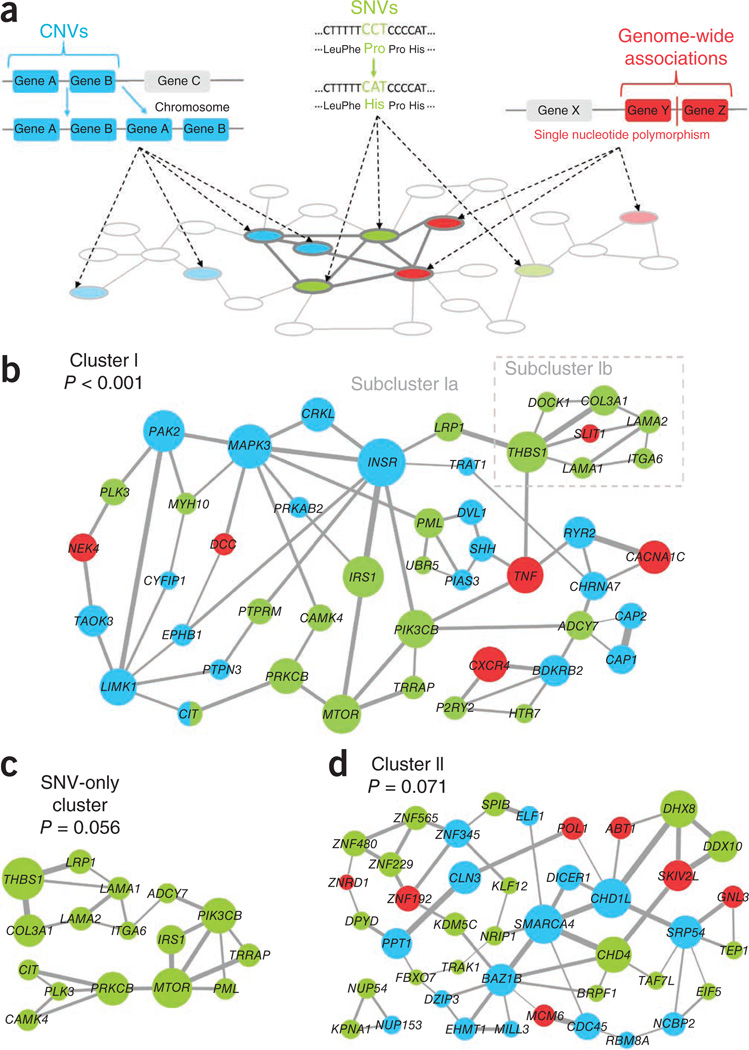
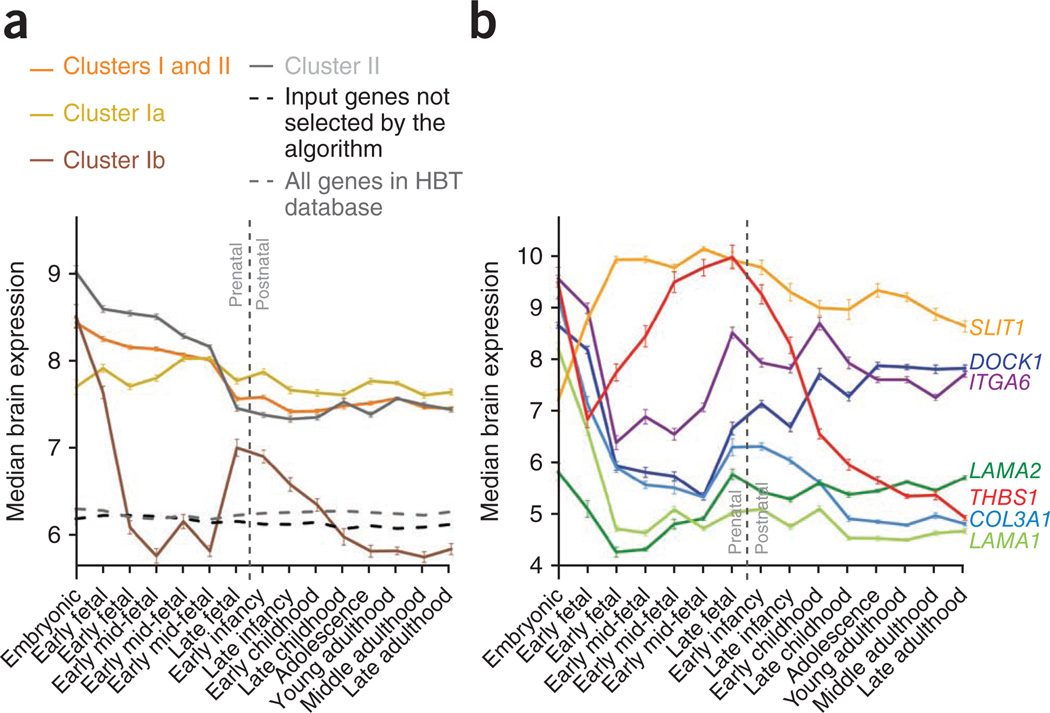
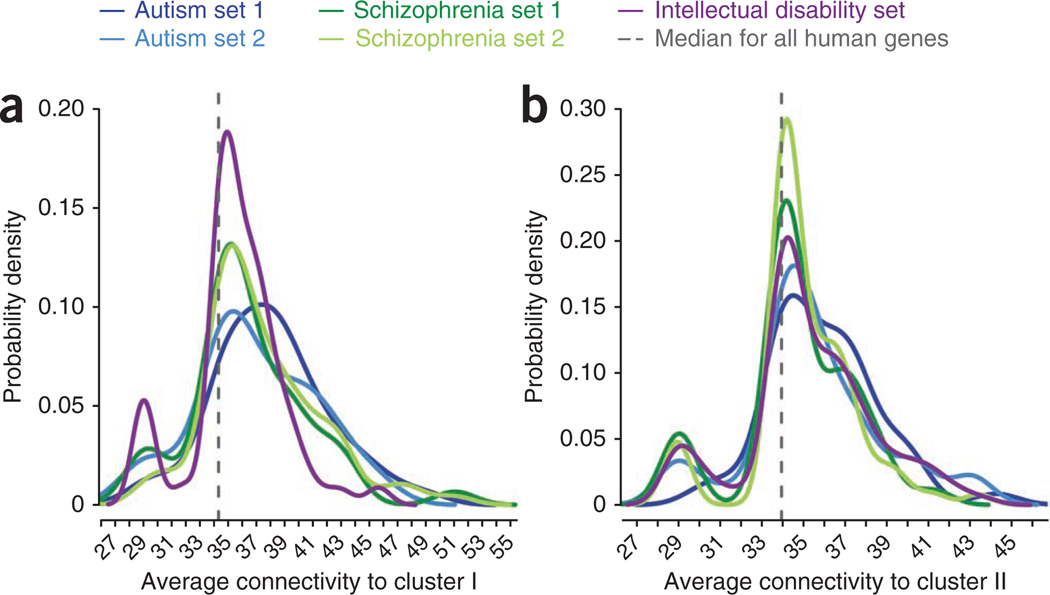
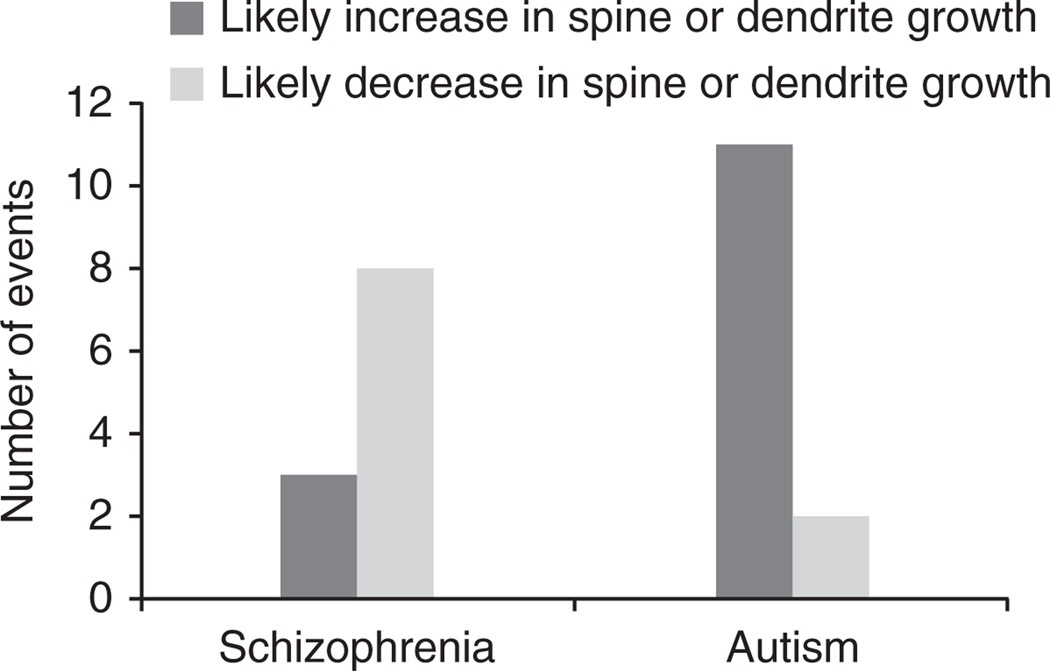
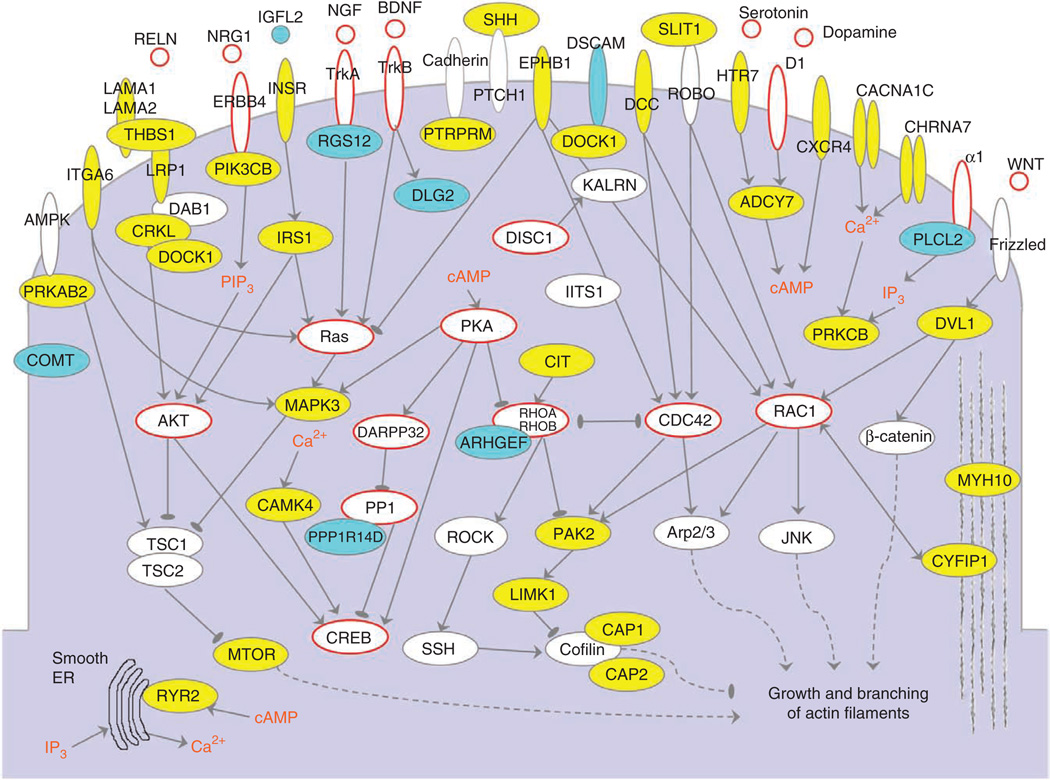
Despite the successful identification of several relevant genomic loci, the underlying molecular mechanisms of schizophrenia remain largely unclear. We developed a computational approach (NETBAG+) that allows an integrated analysis of diverse disease-related genetic data using a unified statistical framework. The application of this approach to schizophrenia-associated genetic variations, obtained using unbiased whole-genome methods, allowed us to identify several cohesive gene networks related to axon guidance, neuronal cell mobility, synaptic function and chromosomal remodeling. The genes forming the networks are highly expressed in the brain, with higher brain expression during prenatal development. The identified networks are functionally related to genes previously implicated in schizophrenia, autism and intellectual disability. A comparative analysis of copy number variants associated with autism and schizophrenia suggests that although the molecular networks implicated in these distinct disorders may be related, the mutations associated with each disease are likely to lead, at least on average, to different functional consequences.


Figures

Figure 1
Figure 1
The NETBAG+ approach and the identified schizophrenia gene clusters. (a) The NETBAG+ algorithm: different types of genetic variations are mapped to a phenotype network (pale gray) in which every pair of genes is assigned a score proportional to the likelihood ratio that those genes share a genetic phenotype. Strongly interconnected clusters (dark gray) are identified among disease-associated genes. Cluster scores are based on the weighted sum of edges between all genes in the cluster; this score is proportional to the likelihood that all cluster genes share the same phenotype. Cluster significance is then established by an appropriate randomization (Online Methods). (b) Cluster results from the combined set of schizophrenia-associated genetic variations: genes from de novo CNVs are in blue, genes from non-synonymous de novo SNVs are in light green and genes from GWAS-implicated regions in dark red. Edge widths are proportional to the strength of the likelihood score between the two genes, and node sizes are proportional to the gene’s contribution to the overall cluster score (Online Methods). For simplicity, only the strongest two edges from each gene are shown. Cluster I was the best cluster from the combined set of all schizophrenia genetic variations (P < 0.001). (c) The best cluster found when using only genes affected by non-synonymous de novo SNVs (P = 0.056). (d) Cluster II, the best cluster from the combined set of all schizophrenia genetic variations when the genes forming cluster I were removed from the input data (P = 0.071).
Figure 2
Figure 2
Temporal gene expression profiles in the brain across developmental stages for genes forming the identified clusters. Gene expression data were obtained from the Human Brain Transcriptome database (http://hbatlas.org/). Median expression levels for each gene were quantile normalized values and log2-transformed across all samples. (a) Temporal profiles of the median gene expression for the schizophrenia clusters shown in Figure 1. Temporal profiles of the average gene expression are shown in Supplementary Figure 1. Error bars represent s.e.m. across all applicable genes. (b) Temporal expression profiles for individual genes forming subcluster Ib. Five genes in this subcluster (DOCK1, ITGA6, LAMA2, THBS1 and COL3A1) independently exhibited U-shaped expression profiles; that is, high expression during embryonic development followed by a decrease in early or mid-fetal development and then an increase during late fetal development or infancy. Error bars represent s.e.m. across samples.
Figure 3
Figure 3
Distributions of connectivity strengths between schizophrenia clusters and genes previously implicated in schizophrenia and other related disorders. (a) Distributions of connectivity strengths between cluster I and disease sets. (b) Distributions of connectivity between cluster II and disease sets. The x axes show corresponding likelihood scores in the NETBAG+ phenotypic network. Disease sets shown in the figure are an autism network from the analysis of de novo CNVs11, a curated set of autism genes, two lists of schizophrenia genes and a list of intellectual disability genes. The distributions were smoothed using a Gaussian kernel. Vertical dashed lines indicate the median connectivity strength between the schizophrenia clusters identified in the present study and all human genes sequenced in a recent study.
Figure 4
Figure 4
Likely impact of genes from de novo CNVs in autism and schizophrenia on growth of dendrites or dendritic spines. Using the dosage changes (deletion or duplication) for CNV-associated genes in the schizophrenia and autism clusters, we explored available literature for phenotypes related to growth changes of dendrites or dendritic spines. This analysis showed that whereas de novo CNVs in autism primarily lead to an increase in growth of dendrites or dendritic spines, de novo CNVs in schizophrenia lead, on average, to the opposite effect. The difference in the phenotypic impact for the two disorders was significant (Fisher’s exact test, two-tailed, P = 0.01; Barnard’s exact test, two-tailed, P = 0.007). Genes that were considered in the analysis, their corresponding CNVs and predicted functional impact are provided in Supplementary Table 4.
Figure 5
Figure 5
Genes forming cluster I in the context of cellular signaling pathways. Proteins encoded by cluster genes are shown in yellow, and those corresponding to other relevant genes that were present in the input data but not selected by the NETBAG+ algorithm are shown in cyan. Proteins and signaling molecules that were not part of the input data but were previously implicated in schizophrenia are circled in red. ER, endoplasmic reticulum; IP3, inositol-1,4,5-trisphosphate; PIP3, phosphatidylinositol-1,4,5-trisphosphate.

References

    1. International Schizophrenia Consortium. Common polygenic variation contributes to risk of schizophrenia and bipolar disorder. Nature. 2009;460:748–752. - PMC - PubMed
    1. O’Donovan MC, et al. Identification of loci associated with schizophrenia by genome-wide association and follow-up. Nat. Genet. 2008;40:1053–1055. - PubMed
    1. Ripke S, et al. Genome-wide association study identifies five new schizophrenia loci. Nat. Genet. 2011;43:969–976. - PMC - PubMed
    1. Yue WH, et al. Genome-wide association study identifies a susceptibility locus for schizophrenia in Han Chinese at 11p11.2. Nat. Genet. 2011;43:1228–1231. - PubMed
    1. Malhotra D, Sebat J. CNVs: harbingers of a rare variant revolution in psychiatric genetics. Cell. 2012;148:1223–1241. - PMC - PubMed

Publication types

MeSH terms