. 2012 Dec;44(12):1382-7.
doi: 10.1038/ng.2452. Epub 2012 Nov 11.

Vertebrate kidney tubules elongate using a planar cell polarity-dependent, rosette-based mechanism of convergent extension

Affiliations

Vertebrate kidney tubules elongate using a planar cell polarity-dependent, rosette-based mechanism of convergent extension

Soeren S Lienkamp et al. Nat Genet. 2012 Dec.

Abstract

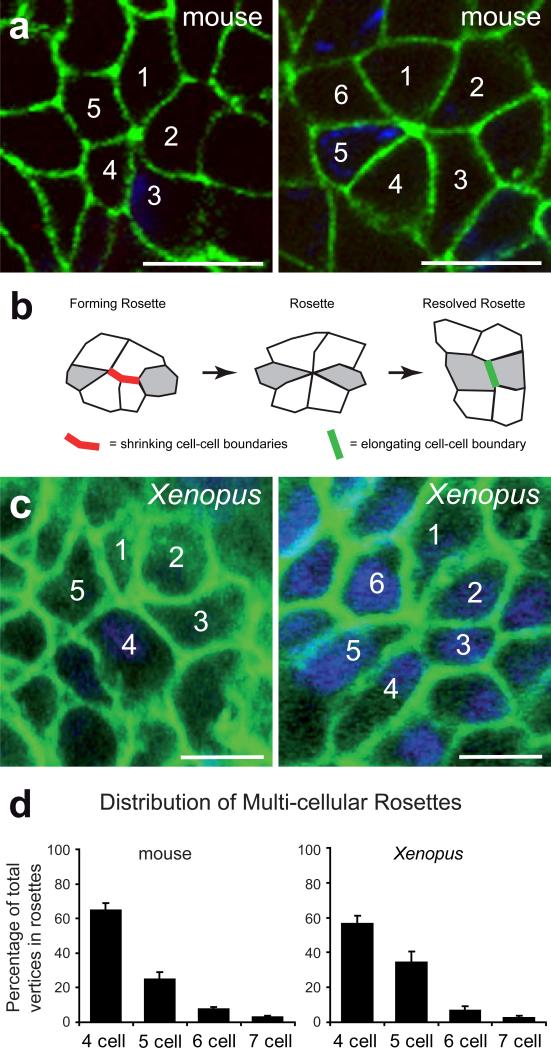
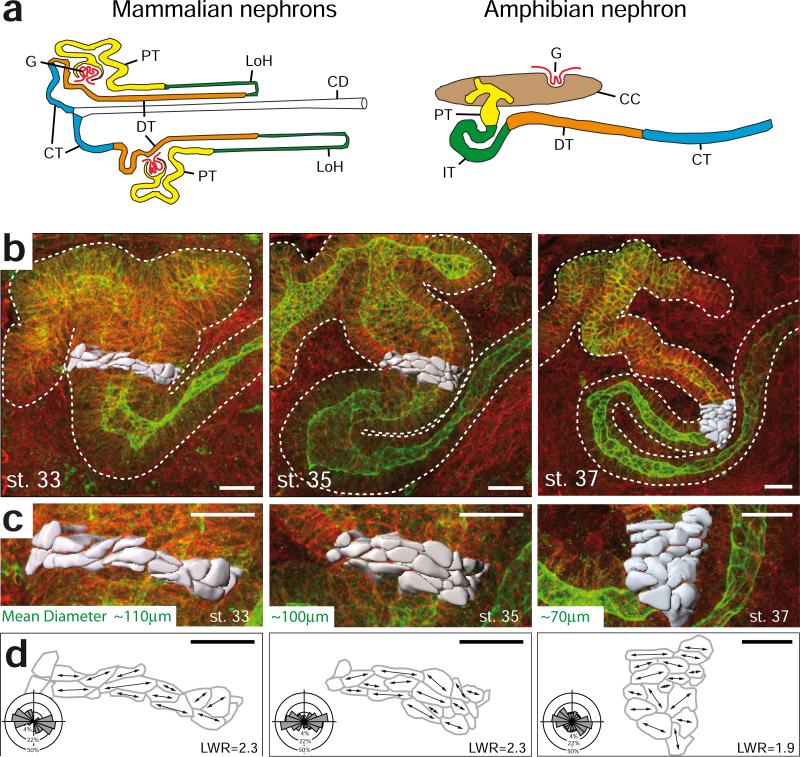
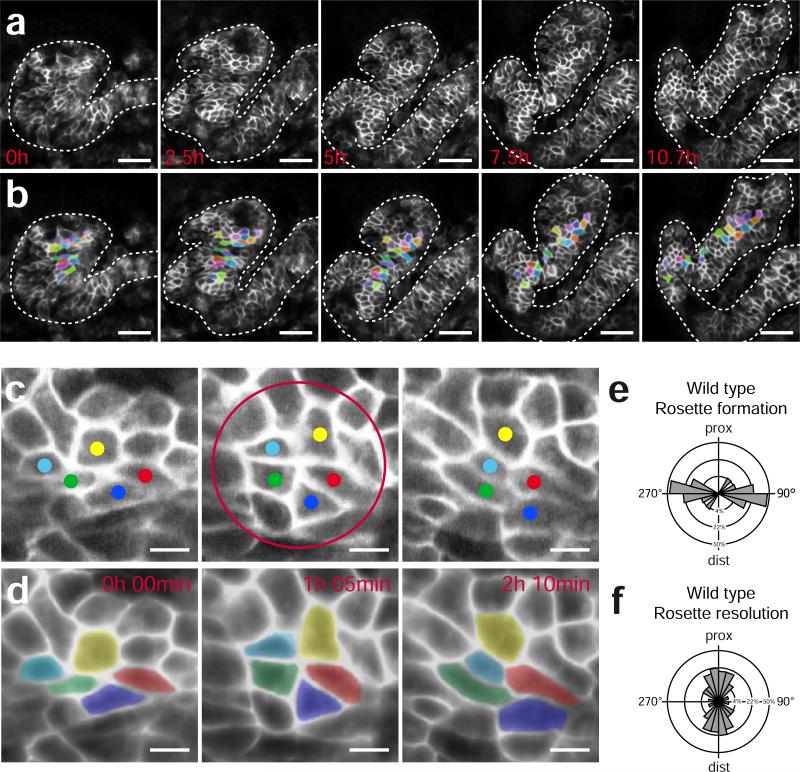
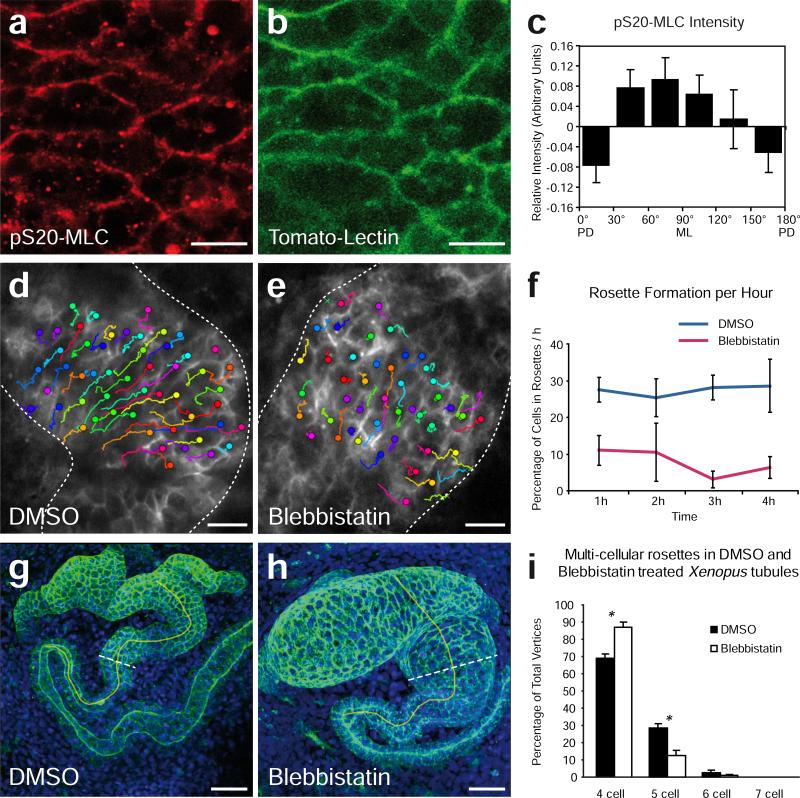
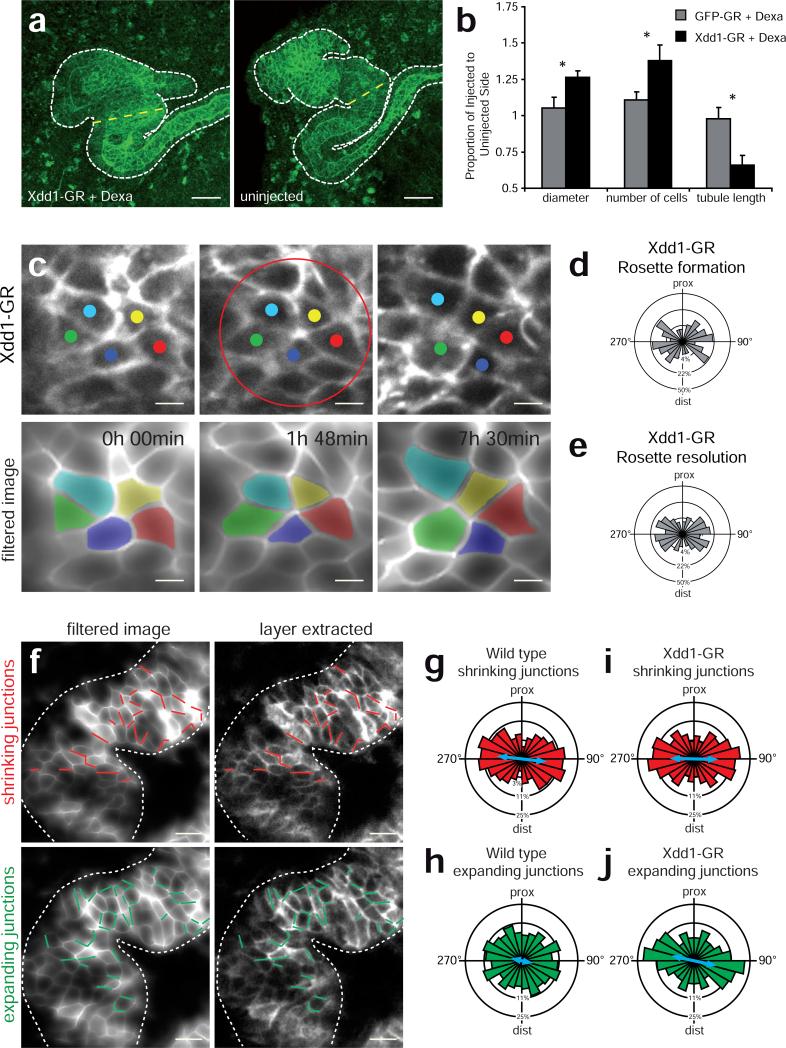
Cystic kidney diseases are a global public health burden, affecting over 12 million people. Although much is known about the genetics of kidney development and disease, the cellular mechanisms driving normal kidney tubule elongation remain unclear. Here, we used in vivo imaging to show for the first time that mediolaterally oriented cell intercalation is fundamental to vertebrate kidney morphogenesis. Unexpectedly, we found that kidney tubule elongation is driven in large part by a myosin-dependent, multicellular rosette-based mechanism, previously only described in Drosophila melanogaster. In contrast to findings in Drosophila, however, non-canonical Wnt and planar cell polarity (PCP) signaling is required to control rosette topology and orientation during vertebrate kidney tubule elongation. These data resolve long-standing questions concerning the role of PCP signaling in the developing kidney and, moreover, establish rosette-based intercalation as a deeply conserved cellular engine for epithelial morphogenesis.


Figures

Figure 1
Figure 1. Multi-cellular rosettes are conserved in mammalian kidney development
(a) E-cadherin immunostaining (green) of E15.5 mouse kidney collecting ducts demonstrates the presence of multi-cellular rosettes. Scale bar, 10 μm. (b) Diagram of rosette formation and resolution during morphogenesis of Drosophila germ bad extension. (c) Immunostaining of fixed Xenopus tubules at stage 37 (anti-memGFP, green; DAPI blue) also detects rosettes. Scale bar, 10 μm. (d) The quantitative analysis of the fraction of vertices in rosette formation in mouse and Xenopus kidneys shows a similar distribution of rosette composition in both vertebrate species (Xenopus: n=96 rosettes in 7 embroys; mouse: n=263 rosettes in 3 embryos, collecting ducts; error bars: SEM).
Figure 2
Figure 2. Elongation of vertebrate kidney tubules by mediolateral cell intercalation
(a) Diagram depicting the structural similarities between the mammalian and amphibian nephron segments: Glomerulus (G), proximal tubule (PT, yellow), Loop of Henle (LoH, green), distal tubule (DT, orange), connecting tubule (CT, blue), collecting duct (CD, white), intermediate tubule (IT, green), coelomic cavity (CC, brown). The Figure was adapted with permission from . (b) The morphology of the developing renal tubule of Xenopus is visualized by staining for β-catenin (red; cell borders) and tomato-lectin (green; tubule epithelium) (scale bar = 20 μm). 20 cells in the intermediate tubule are volume rendered based on the cell borders using 3D visualization software (gray). (c) Enlarged view of volume-rendered cells as depicted in (b) (scale bar = 20 μm). (d) Depiction of the cell outlines at the basal surface of the tubule. Arrows in the traced cells indicate the longest diameter at the basal side. Rose plots show that the angular distribution is biased towards the medial-lateral axis with a length-to-width ratio (LWR) between 1.9 and 2.3. (top: proximal; bottom: distal) (n=42 cells in 3 to 4 embryos of each stage). The outer circle represents 50%, the middle circle 22% and the inner circle 4% of total observations (scale bar = 20 μm).
Figure 3
Figure 3. Morphogenetic movements of renal tubule cells employs rosette formation
(a) Time-lapse confocal imaging and tracking of individual tubule cells demonstrate convergent extension movements within the developing kidney tubule of Xenopus laevis (see also Supplementary Movies 2 and 3). Scale bar, 50 μm. (b) Cells were segmented and colored to visualize cell rearrangement over the course of 10.7 hours. (c) Layer extracted still images of a forming and resolving rosette (red circle) from time lapse recordings (top: proximal; bottom distal) (see also Supplementary Movies 2 and 3). Scale bar, 10 μm. (d) Corresponding images, filtered and colored, demonstrating rosette formation and resolution. (e) Rosettes form predominantly in a medial-lateral angle. (f) Resolution is biased towards a proximal-distal angle. Rose plots demonstrate the angular distribution of 33 forming and resolving rosettes in 3 tubules (p<0.01, Mardia-Watson-Wheeler test). The outer circle represents 50%, the middle circle 22% and the inner circle 4% of total observations.
Figure 4
Figure 4. Inhibition of myosin interferes with cell movement in Xenopus tubule formation
Immunostaining for (a) S20-phosphorylated myosin light chain (pS20-MLC) and (b) Lycopersicon Esculentum (Tomato) Lectin, which stains the membrane of tubule epithelial cells. Scale bar, 20 μm. (c) Densitometric analysis showed that the strongest signal of activated myosin light chain is detected at medio-laterally (ML) oriented cell junctions. Cell borders were categorized into six groups with angles between 0 and 180 degrees; pS20-MLC intensity was normalized against Tomato Lectin in ten kidney tubules, and depicted as bar graph (PD, posterodistal) (p=0.05, ANOVA, n=312 junctions, error bars: SEM). (d,e) Parallel in vivo time-lapse analysis of DMSO- versus blebbistatin-treated embryos shows the disrupted cell rearrangement during tubule morphogenesis. Colored tracks show the displacement of cells over time (up to three hours). Crosses indicate cells that could not be tracked to the last frame. Scale bar, 20 μm. (f) Quantification of the number of cells participating in newly formed higher order (5 or more cell-) rosettes. Rosette detection was aided by a computerized algorithm on filtered images (see Supplementary Movies 4 and 5). (p<0.001, t-test, n=4 embryos, 721 cells in DMSO , 1341 in blebbistatin treated group analyzed, error bars: SEM). (g,h) Treatment with blebbistatin between stage 33 and 37 (tomato-lectin-FITC, green; DAPI, blue) prevented elongation and narrowing of the renal tubule. Brocken lines indicate the position of the cross sections taken for measurements. The yellow line indicates the anatomical landmarks used for measuring tubule length (the fusion point of the nephrostomes to the anterior bending of the intermediate tubule) Scale bar, 50 μm. (i) The complexity of multi-cellular rosettes was reduced by Blebbistatin treatment in fixed Xenopus tubules (DMSO n=9, Blebbistatin n=10 tubules, * p<0,01, t-test, error bars: SEM)
Figure 5
Figure 5. PCP signaling controls polarized resolution of multi-cellular rosettes in developing vertebrate kidney tubules
(a) Expression of dexamethasone-inducible Xdd1 (Xdd1-GR) resulted in shorter and wider tubules than on the uninjected control side in Xenopus embryos. The uninjected side is shown as a mirror image. Scale bar, 50 μm. (b) Quantification of tubules shows a significantly larger diameter, an increased number of cells and decreased tubule length in treated embryos. (GFP-GR n=15, Xdd1-GF n=10 embryos; p< 0.05, t-test, error bars: SEM) (c) Time-lapse imaging of tubule cells shows that rosette formation and resolution is disrupted by Xdd1 (top panel) Filtered and colored images of rosette forming and resolving cells (bottom panel, see also Supplementary Movie 8). Top: proximal; bottom: distal; Scale bar, 10 μm. (d) Rose plot of angular distribution of forming and (e) of resolving rosettes. (n= 30 rosettes in 4 tubules). The outer circle represents 50%, the middle circle 22% and the inner circle 4% of total observations. (f) Analysis of junctional remodeling over a 30 min interval in a wild type tubule. Shrinking junctions are depicted in red (top panel). Expanding junctions are marked green (bottom panel). Scale bar, 20 μm. (g) The angular distribution of wild type shrinking junctions is mediolaterally biased. The blue arrow represents the length of the mean vector (r) (n=82 junctions in 3 embryos) (h) The distribution of expanding junctions is significantly less biased (p < 0,05, Mardia-Watson-Wheeler test) (n=96 junctions in 3 embryos). (i) In Xdd1 expressing tubules, shrinking junctions are mediolaterally biased (n=118 junctions in 3 embryos). (j) The distribution of expanding junctions in Xdd1 expressing cells is not random, but biased mediolaterally (n=116 junctions in 3 embryos). The circles represent 25%, 11% and 3% respectively in (g-j).

References

    1. Torres VE, Harris PC, Pirson Y. Autosomal dominant polycystic kidney disease. Lancet. 2007;369:1287–301. - PubMed
    1. McNeill H. Planar cell polarity and the kidney. J Am Soc Nephrol. 2009;20:2104–11. - PubMed
    1. Chapin HC, Caplan MJ. The cell biology of polycystic kidney disease. J Cell Biol. 2010;191:701–10. - PMC - PubMed
    1. Costantini F. Renal branching morphogenesis: concepts, questions, and recent advances. Differentiation. 2006;74:402–21. - PubMed
    1. Karner CM, et al. Wnt9b signaling regulates planar cell polarity and kidney tubule morphogenesis. Nat Genet. 2009;41:793–9. - PMC - PubMed

Publication types