

doi: 10.1039/c2dt32462h.
Epub 2012 Nov 12.
Photoluminescent DNA binding and cytotoxic activity of a platinum(II) complex bearing a tetradentate β-diketiminate ligand
Affiliations
- PMID: 23143731
- PMCID: PMC3566370
- DOI: 10.1039/c2dt32462h
Item in Clipboard
Photoluminescent DNA binding and cytotoxic activity of a platinum(II) complex bearing a tetradentate β-diketiminate ligand
Dalton Trans.
.
Abstract
A platinum(II) complex of a monoanionic, tetradentate β-diketiminate (BDI) ligand with pendant quinoline arms, BDI(QQ)H, is reported. The complex, [Pt(BDI(QQ))]Cl, is emissive in DMSO, but non-emissive in aqueous buffer. Upon binding DNA in buffer, however, a 150-fold turn-on in emission intensity occurs. Dynamic light scattering and (1)H NMR spectroscopy indicate that [Pt(BDI(QQ))]Cl forms non-emissive aggregates in aqueous solution; DNA-binding disperses the aggregates leading to the large emission turn-on response. The cytotoxic activity of the complex, measured in two cancer cell lines, is comparable to or better than that of the established anticancer drug cisplatin.
Figures
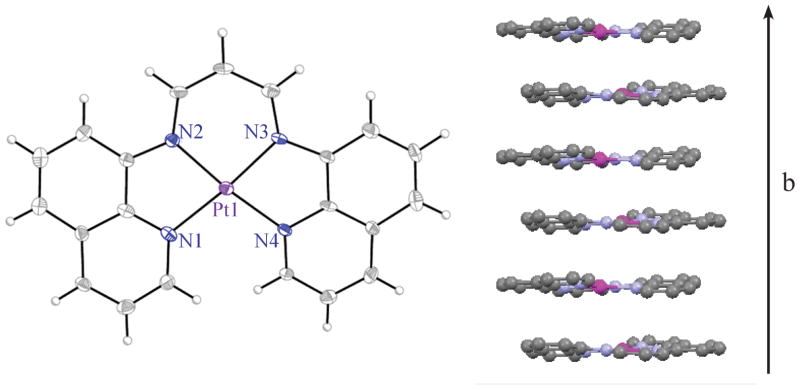
X-ray crystal structure of [Pt(BDIQQ)]+ (left). Ellipsoids are drawn at the 50% probability level. Unlabeled grey and white ellipsoids correspond to carbon and hydrogen atoms, respectively. Intermolecular stacking interaction observed in the crystal lattice (right).
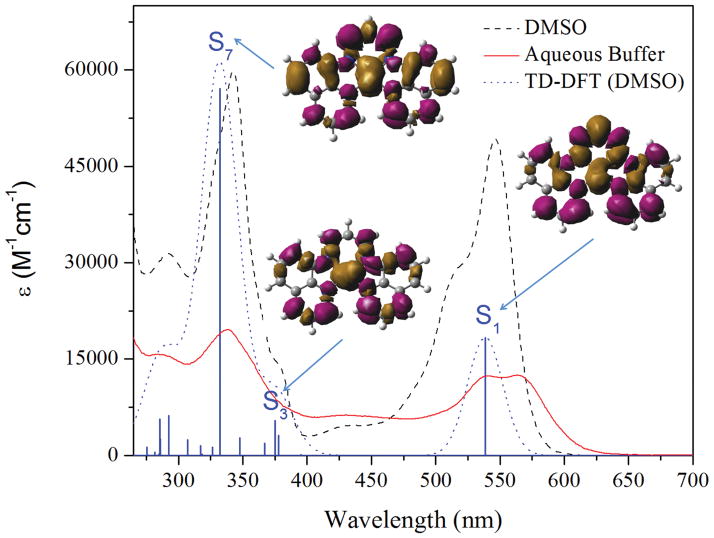
UV-vis spectra of [Pt(BDIQQ)]Cl in DMSO (black, dashed) and aqueous buffer (red, solid, pH 7.4, 10 mM Tris, 10 mM NaCl). The dotted blue line is the simulated UV-vis spectrum from TD-DFT calculations with a DMSO solvation model. The solid blue bars represent individual singlet transitions, and the associated EDDMs for selected transitions are displayed.
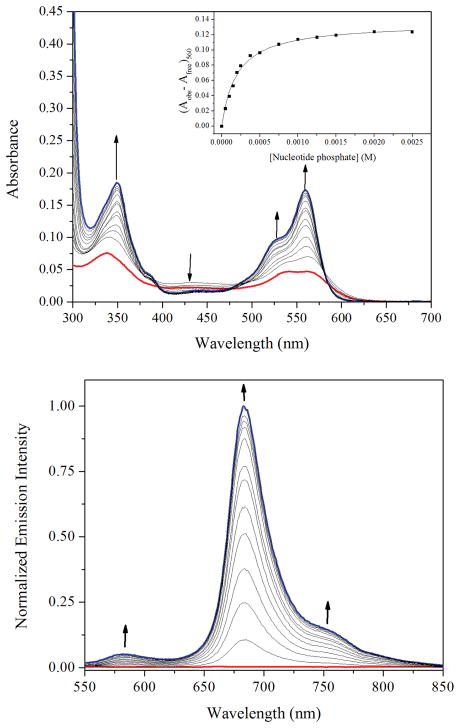
UV-vis (top) and emission (bottom) spectral changes of [Pt(BDIQQ)]Cl upon the addition of up to 500 equiv. nucleotide of CT-DNA in buffer (pH 7.4, 10 mM Tris, 10 mM NaCl) after a 16 h equilibration period. The black arrows mark the spectral changes as the concentration of CT-DNA increases. The inset shows a plot of [DNA] vs. absorbance at 560 nm.
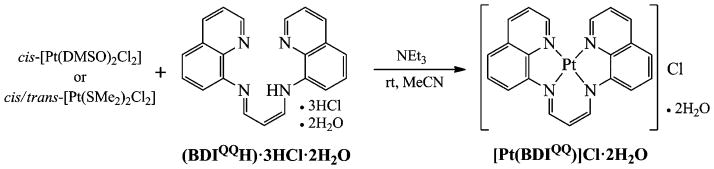
Synthesis of [Pt(BDIQQ)]Cl.
References
-
- Bailey JA, Hill MG, Marsh RE, Miskowski VM, Schaefer WP, Gray HB. Inorg Chem. 1995;34:4591.
-
- Connick WB, Henling LM, Marsh RE, Gray HB. Inorg Chem. 1996;35:6261.
-
- Lai SW, Che CM. Top Curr Chem. 2004;241:27.
-
- Howe-Grant M, Wu KC, Bauer WR, Lippard SJ. Biochemistry. 1976;15:4339. - PubMed
Publication types
MeSH terms
Substances
Grants and funding
LinkOut - more resources
Full Text Sources
Other Literature Sources