. 2012 Dec 28;287(53):44071-82.
doi: 10.1074/jbc.M112.401356. Epub 2012 Nov 9.

Conjugated linoleic acid is a preferential substrate for fatty acid nitration

Affiliations

Conjugated linoleic acid is a preferential substrate for fatty acid nitration

Gustavo Bonacci et al. J Biol Chem. .

Abstract

The oxidation and nitration of unsaturated fatty acids by oxides of nitrogen yield electrophilic derivatives that can modulate protein function via post-translational protein modifications. The biological mechanisms accounting for fatty acid nitration and the specific structural characteristics of products remain to be defined. Herein, conjugated linoleic acid (CLA) is identified as the primary endogenous substrate for fatty acid nitration in vitro and in vivo, yielding up to 10(5) greater extent of nitration products as compared with bis-allylic linoleic acid. Multiple enzymatic and cellular mechanisms account for CLA nitration, including reactions catalyzed by mitochondria, activated macrophages, and gastric acidification. Nitroalkene derivatives of CLA and their metabolites are detected in the plasma of healthy humans and are increased in tissues undergoing episodes of ischemia reperfusion. Dietary CLA and nitrite supplementation in rodents elevates NO(2)-CLA levels in plasma, urine, and tissues, which in turn induces heme oxygenase-1 (HO-1) expression in the colonic epithelium. These results affirm that metabolic and inflammatory reactions yield electrophilic products that can modulate adaptive cell signaling mechanisms.


Figures

FIGURE 1.
FIGURE 1.
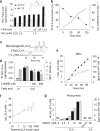
Nitrite induces mitochondrial formation of NO2-FA. Mitochondria were incubated for 2 h with NO2 (0.2–1.0 mm) in phosphate buffer (50 mm, pH 6). a, chromatogram showing nitration of 18:2 fatty acids in mitochondria by [15N]O2 or NO2, cardiac tissue from mice subjected to focal myocardial I/R and [13C18]NO2-LA internal standard, respectively. Product ions of m/z 46 (NO2) and m/z 47 ([15N]O2) were followed upon fragmentation of ions m/z 324.2 and 325.2, respectively. b, MS-MS spectra of mitochondrial NO2-FA showing characteristic losses of H2O and NO2 derived from organic nitro groups. c, NO2 and pH dependence of mitochondrial fatty acid formation (followed as 324.2/46 MRM transition). ND, not detected. Results represent the mean of three independent experiments ± S.D.
FIGURE 2.
FIGURE 2.
Structural analysis of NO2-FA by collision-induced dissociation in the negative ion mode. a, MS/MS spectra of ions with m/z 324.2 (RT for 36.3 and 37.4 min) obtained from mitochondria exposed to NO2. Specific product ions were determined at a 1 ppm level for 12-NO2-CLA (m/z 157.08 (a), 171.10 (b), 195.10 (d), and 213.11 (c)) and for 9-NO2-CLA (m/z 168.10 (e), 210.11 (f), and 224.11 (g)). b, elution profile of NO2-CLA. MRM chromatograms of mitochondrial lipid extracts and CLA acidic nitration (a–g), analyzed by LC-ESI-MS/MS in the negative ion mode using specific transitions for NO2-CLA isomers, were determined in a.
FIGURE 3.
FIGURE 3.
CLA nitration by mitochondria, activated RAW 264.7 macrophages, MPO, and ONOO. a, mitochondria (2 mg) were incubated in the presence of NO2 (0.25–1.0 mm) and supplemented with various fatty acids (1 μm). Lipids were extracted, and NO2-FA was quantified by HPLC-MS/MS using [13C18]NO2-LA as internal standard. Results represent the mean ± S.D. (n = 3), * indicates significantly different (p < 0.05) from control without fatty acid addition. b, NO2-CLA formation from endogenous CLA and the concomitant CLA consumption was quantified by HPLC-MS/MS in mitochondria (2 mg) incubated with NO2 (1 mm) at pH 6 (n = 3). c, chromatogram showing formation of NO2-CLA by activated macrophages in the presence of CLA and internal standards ([15N]O2-CLA and [13C18]NO2-LA). d, incubation with the NOS inhibitor l-NAME decreased NO2 (gray bars) and NO2-CLA (black bars) levels in media. e, CLA (10 μm) nitration induced by MPO/H2O2/NO2 (30 min). Nitration (NO2-CLA, m/z 324.2) and oxidation (NO2-oxo-OA, m/z 340.3) products were quantified using [13C18]NO2-LA as internal standard. f, CLA (10 μm) nitration reactions by MPO were competed using increasing molar ratios of tyrosine (1–400 mol eq, Tyr/CLA). g, ONOO induced formation of NO2-CLA (m/z 324.2) and NO2-oxo-OA (m/z 340.3). Results represent the mean of three independent experiments ± S.D. ND, not detected. d, * and # are significantly different from CLA control (p < 0.05) in the absence of l-NAME (analysis of variance post hoc Tukey's test).
SCHEME 1.
SCHEME 1.
Reaction mechanism of nitrogen dioxide-induced CLA nitration. This pathway also depicts the formation of the hydroxy and keto containing NO2-FA derivatives that can be generated in the presence of oxygen. * denotes electrophilic carbons.
FIGURE 4.
FIGURE 4.
Nitrogen dioxide-mediated nitration of CLA and electrophilic reactivity of NO2-CLA. a, MS/MS chromatograms of NO2-CLA, NO2-OH-OA, and NO2-oxo-OA pre- and post-β-ME (1 mm) reaction. Chromatograms of β-ME adducted NO2-FA followed the neutral loss of 78 atomic mass units (β-ME) (β-ME-NO2-CLA, 402.3/324.2; β-ME-NO2-oxo-OA, 418.3/340.3; β-ME-[13C18]NO2-LA, 420.3/342.2) and show the characteristic shift in the elution time when compared with pre-β-ME reaction NO2-FA. NO2-OH-OA does not display electrophilic reactivity. b, Dess Martin reaction (to oxidize hydroxy groups to ketones) of CLA nitration products shows specific oxidation only for NO2-OH-OA to NO2-oxo-OA and its subsequent gaining of β-ME reactivity. Product displays the same chromatographic profile as NO2-oxo-OA shown in a. Oxygen tension modulates FA nitration product distribution during reaction with NO2. CLA (100 μm) (c) or LA (100 μm) (d) nitration was induced by pure NO2 gas (5.6 ppm) during 60 min under hypoxia (black bars) and normoxia (white bars). Products were quantified by HPLC-MS/MS in the presence of [13C18]NO2-LA. ND, not detected. Results represent the mean of three independent experiments ± S.D.
FIGURE 5.
FIGURE 5.
Detection of NO2-CLA in human plasma. The presence of NO2-CLA was identified and quantified using 9-[15N]O2-CLA and 12-[15N]O2-CLA as internal standards in plasma from seven healthy subjects. a, chromatograms show endogenous NO2-CLA (324/46, middle panel) and internal standard [15N]O2-CLA (325.3/47, upper panel). Confirmation of electrophilic reactivity of the endogenous NO2-CLA was followed upon β-ME reaction (lower panel). b, accurate mass determinations (1 ppm level) of endogenous NO2-CLA and plasma subjected to acidic nitration using Na[15N]O2 (0.5 mm) were determined for both 9- and 12-NO2-CLA.
FIGURE 6.
FIGURE 6.
Gastric formation of [15N]O2-CLA modulates HO-1 expression in gut epithelium and levels in plasma, tissue, and urine. a, fasted mice were injected with pentagastrin (5 mg/kg) 1 h prior to gavage with CLA (100 nmol) and Na[15N]O2 (100 nmol). Lipids were extracted from stomach tissue and analyzed by HPLC-MS/MS. b, rats were fed CLA and Na[15N]O2 via oral gavage once per day for 4 days (100 μmol each), and urine was collected over the final 24 h of treatment. Extracted lipids from urine and different tissues were analyzed by HPLC-MS/MS, revealing endogenous formation of labeled [15N]O2-CLA (m/z 325/47). ND, not detected. c–h, gastric generation of NO2-CLA stimulates expression of HO-1 in rat colon epithelium. Representative images of colon tissue from vehicle controls (c and d), CLA + NO2 (e and f), and synthetic NO2-CLA treatment (g and h) are shown. The actin labeling (green) delineates the adventitia and the apical surface of epithelium. The nuclei are shown in blue (DAPI staining). e and g and f and h (high power magnification), there is intense HO-1 immunoreactivity (red) in the subapical cytoplasm of the epithelial cells (yellow arrowheads). This labeling is absent in the vehicle-treated control tissue (c and d). There is some discrete labeling within the lamina propria in both treated and control animals (white arrows), which corresponds to labeling that typically occurs in the macrophages and occasional dendritic cells found in this locale. Bar, 100 μm. i, NO2-CLA induces HO-1 expression in the mouse macrophage RAW 264.7 cells. Cells were incubated with [15N]O2-CLA (9- and 12-NO2-CLA isomer mixture), 9-NO2-CLA (specific isomer), bis-allylic NO2-LA, and control native fatty acids (CLA and LA) for 12 h. Results represent the mean of three independent experiments ± S.E.; * and # are significantly different from CLA control (p < 0.05) and LA control (p < 0.05) (analysis of variance post hoc Tukey's test).

References

    1. Serhan C. N., Petasis N. A. (2011) Resolvins and protectins in inflammation resolution. Chem. Rev. 111, 5922–5943 - PMC - PubMed
    1. Schopfer F. J., Cipollina C., Freeman B. A. (2011) Formation and signaling actions of electrophilic lipids. Chem. Rev. 111, 5997–6021 - PMC - PubMed
    1. Groeger A. L., Cipollina C., Cole M. P., Woodcock S. R., Bonacci G., Rudolph T. K., Rudolph V., Freeman B. A., Schopfer F. J. (2010) Cyclooxygenase-2 generates anti-inflammatory mediators from ω-3 fatty acids. Nat. Chem. Biol. 6, 433–441 - PMC - PubMed
    1. Cui T., Schopfer F. J., Zhang J., Chen K., Ichikawa T., Baker P. R., Batthyany C., Chacko B. K., Feng X., Patel R. P., Agarwal A., Freeman B. A., Chen Y. E. (2006) Nitrated fatty acids. Endogenous anti-inflammatory signaling mediators. J. Biol. Chem. 281, 35686–35698 - PMC - PubMed
    1. Saravanan P., Davidson N. C., Schmidt E. B., Calder P. C. (2010) Cardiovascular effects of marine ω-3 fatty acids. Lancet 376, 540–550 - PubMed

Publication types