

Spatially varying predictors of teenage birth rates among counties in the United States
- PMID: 23144587
- PMCID: PMC3493119
- DOI: 10.4054/DemRes.2012.27.14
Spatially varying predictors of teenage birth rates among counties in the United States
Abstract
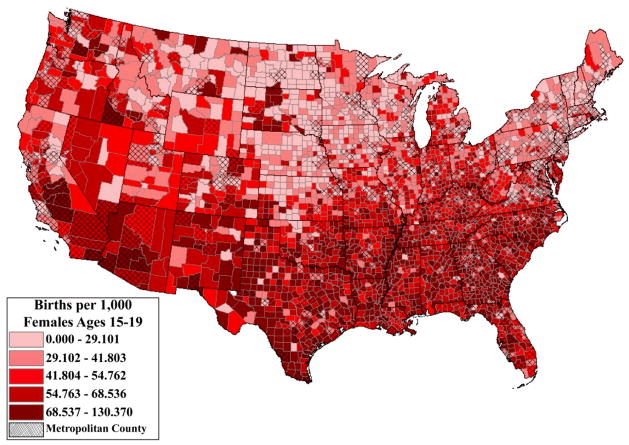
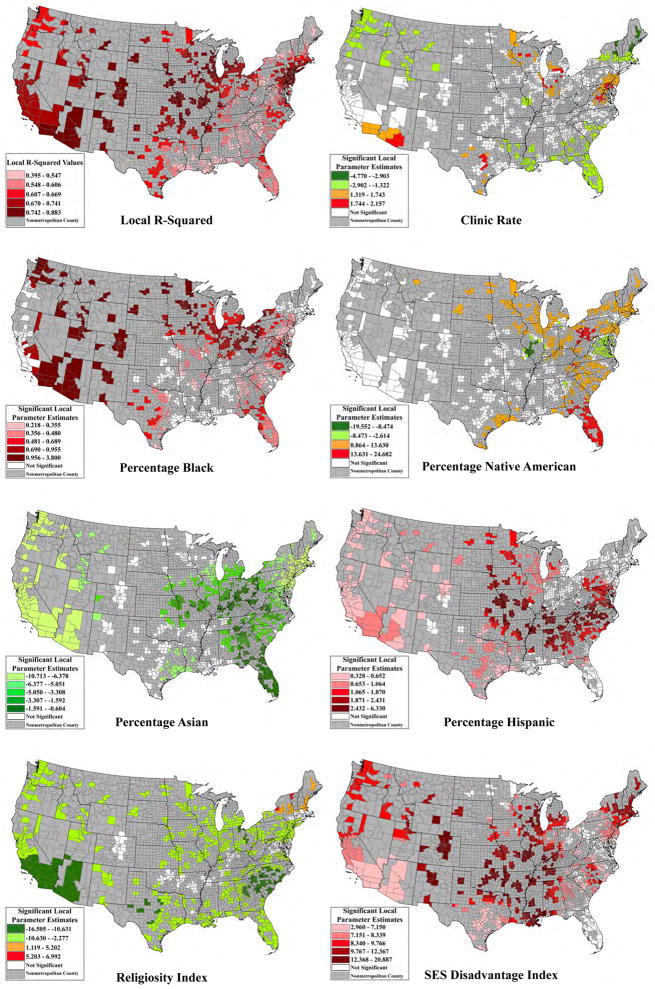
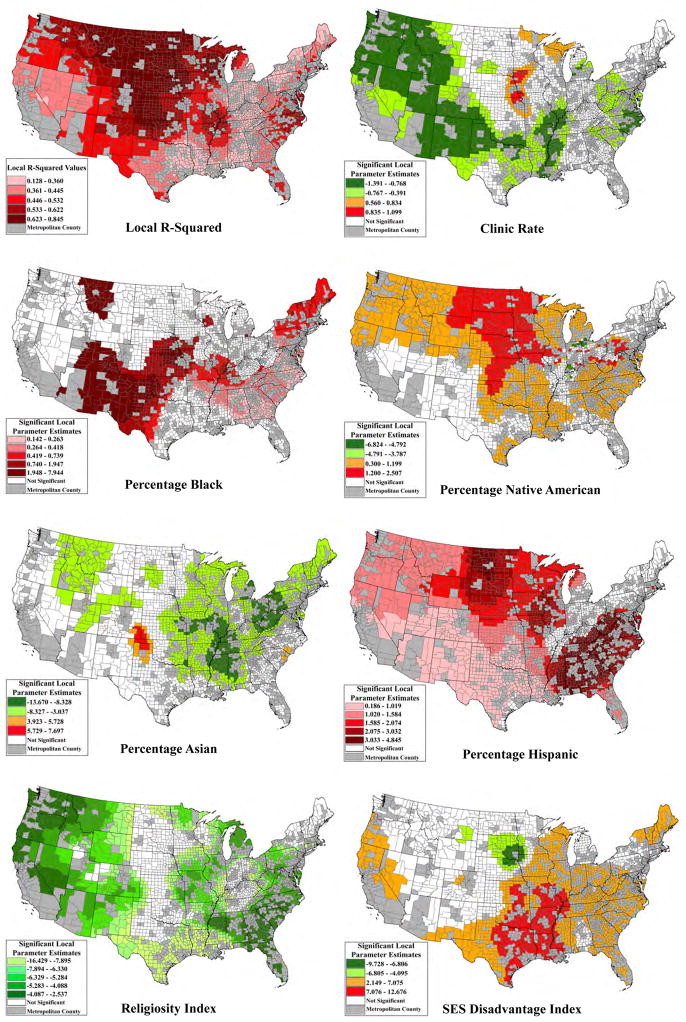
BACKGROUND: Limited information is available about teenage pregnancy and childbearing in rural areas, even though approximately 20 percent of the nation's youth live in rural areas. Identifying whether there are differences in the teenage birth rate (TBR) across metropolitan and nonmetropolitan areas is important, because these differences may reflect modifiable ecological-level influences such as education, employment, laws, healthcare infrastructure, and policies that could potentially reduce the TBR. OBJECTIVES: The goals of this study are to investigate whether there are spatially varying relationships between the TBR and the independent variables, and if so, whether these associations differ between metropolitan and nonmetropolitan counties. METHODS: We explore the heterogeneity within metropolitan/nonmetropolitan county groups separately using geographically weighted regression (GWR), and investigate the difference between metropolitan/nonmetropolitan counties using spatial regime models with spatial errors. These analyses were applied to county-level data from the National Center for Health Statistics and the US Census Bureau. RESULTS: GWR results suggested that non-stationarity exists in the associations between TBR and determinants within metropolitan/nonmetropolitan groups. The spatial regime analysis indicated that the effect of socioeconomic disadvantage on TBR significantly varied by the metropolitan status of counties. CONCLUSIONS: While the spatially varying relationships between the TBR and independent variables were found within each metropolitan status of counties, only the magnitude of the impact of the socioeconomic disadvantage index is significantly stronger among metropolitan counties than nonmetropolitan counties. Our findings suggested that place-specific policies for the disadvantaged groups in a county could be implemented to reduce TBR in the US.
Figures
References
-
- Allen DW. Social class, race, and toxic releases in American counties, 1995. The Social Science Journal. 2001;38(1):13–25.
-
- Anselin L. Spatial Econometrics: Methods and Models. Cordrecht: Kluwer Academic Publishers; 1988.
-
- Anselin L. Spatial dependence and spatial structural instability in applied regression analysis. Journal of Regional Science. 1990a;30(2):185–207.
-
- Anselin L. What is special about spatial data? Alternative perspectives on spatial data analysis. In: Griffith DA, editor. Spatial Statistics, Past, Present, and Future. Ann Arbor, MI: Institute of Mathematical Geography; 1990b. pp. 63–77.
-
- Anselin L, Syabri I, Kho Y. OpenGeoDa: An Introduction to Spatial Analysis. Tempe, AZ: GeoDa Center for Geospatial Analysis and Computation; 2005. OpenGeoDa.
Grants and funding
LinkOut - more resources
Full Text Sources