. 2012 May;121(4):24-43.
doi: 10.5594/j18173.

Stereoscopy and the Human Visual System

Stereoscopy and the Human Visual System

Martin S Banks et al. SMPTE Motion Imaging J. 2012 May.

Abstract

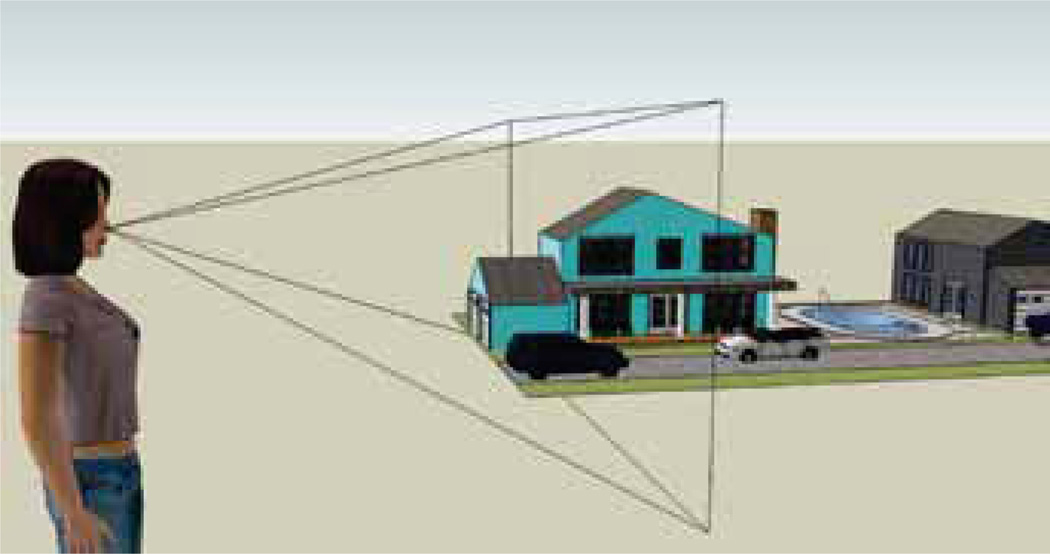
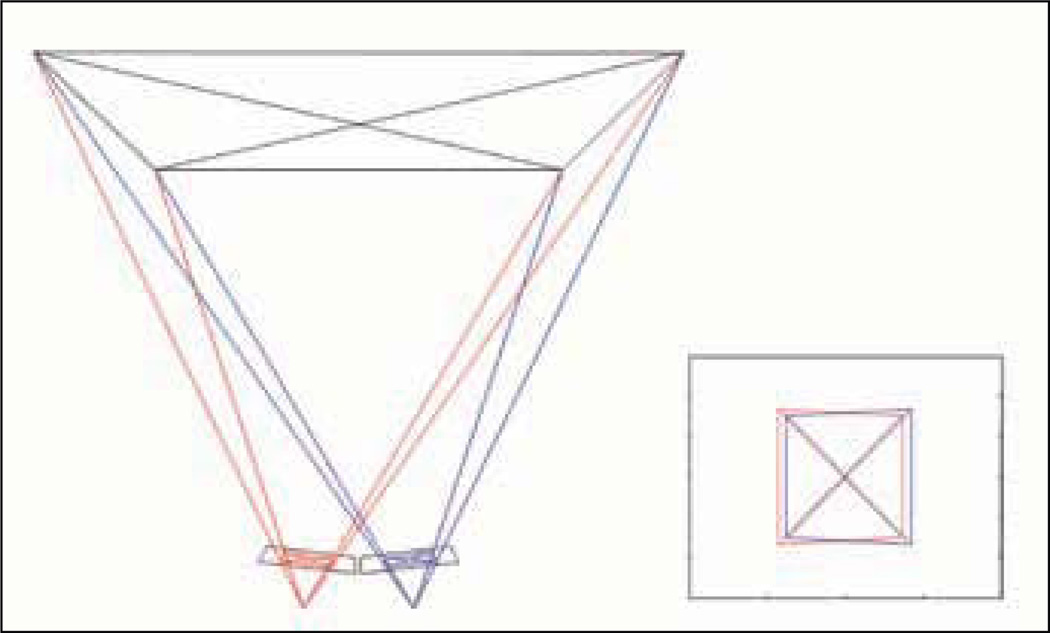
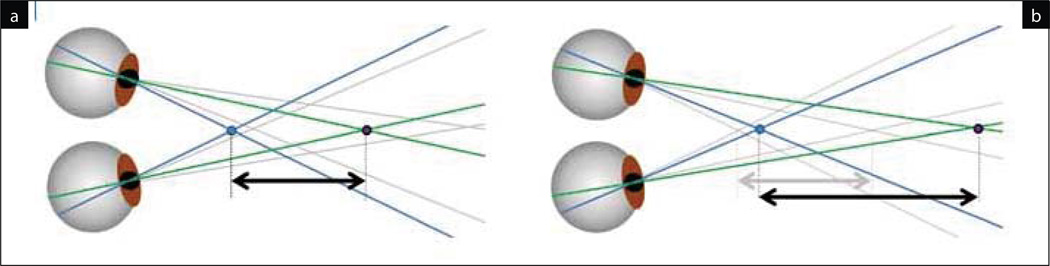
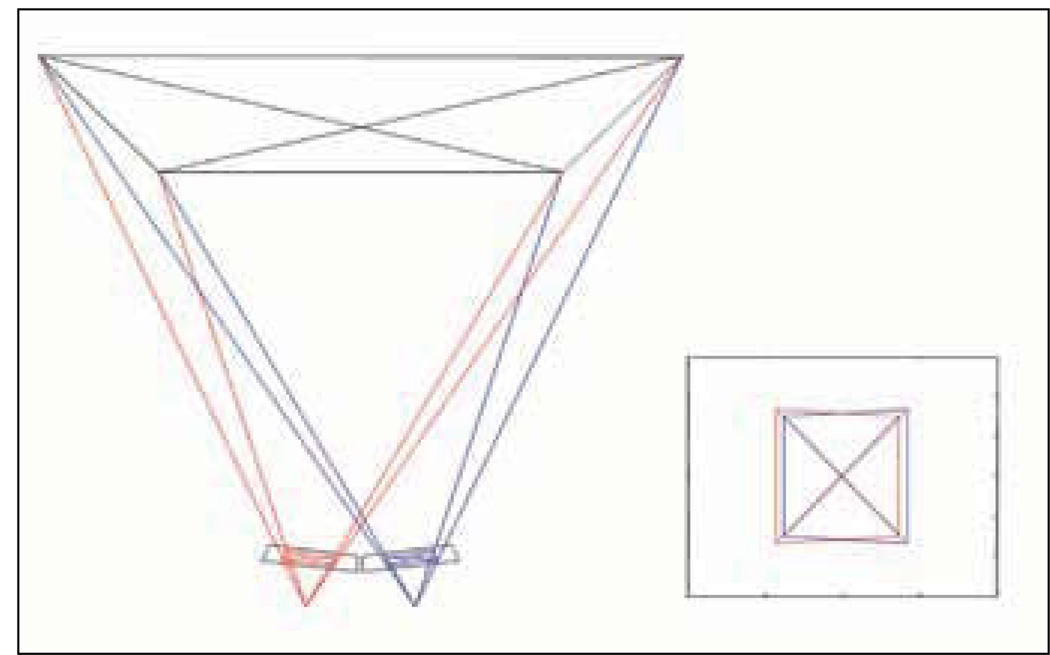
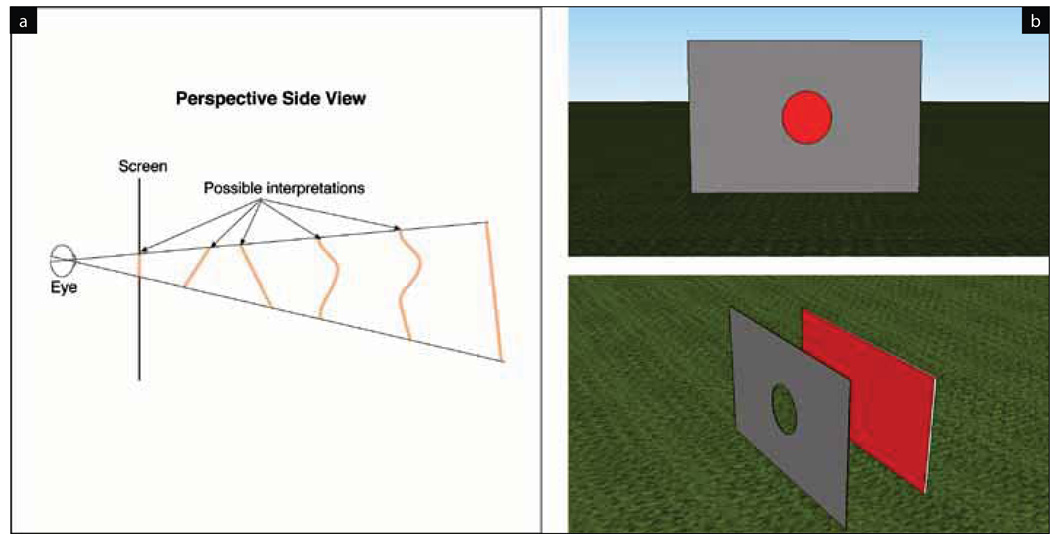
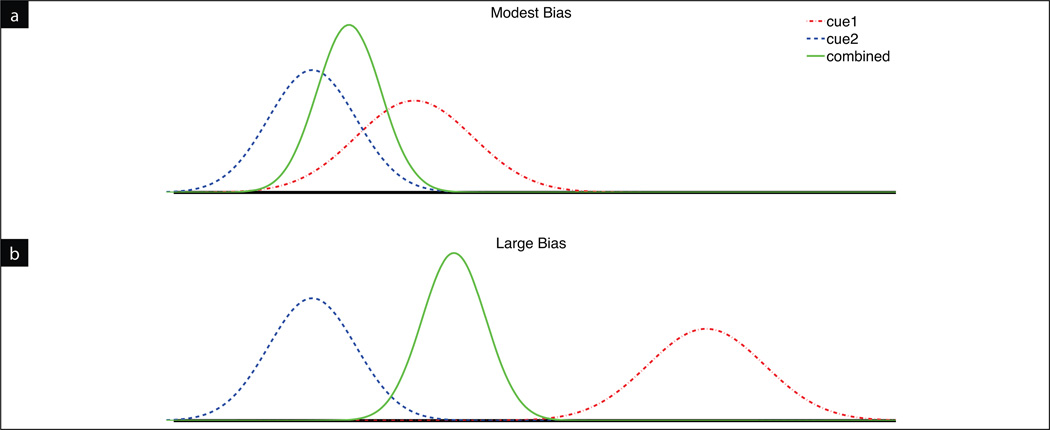
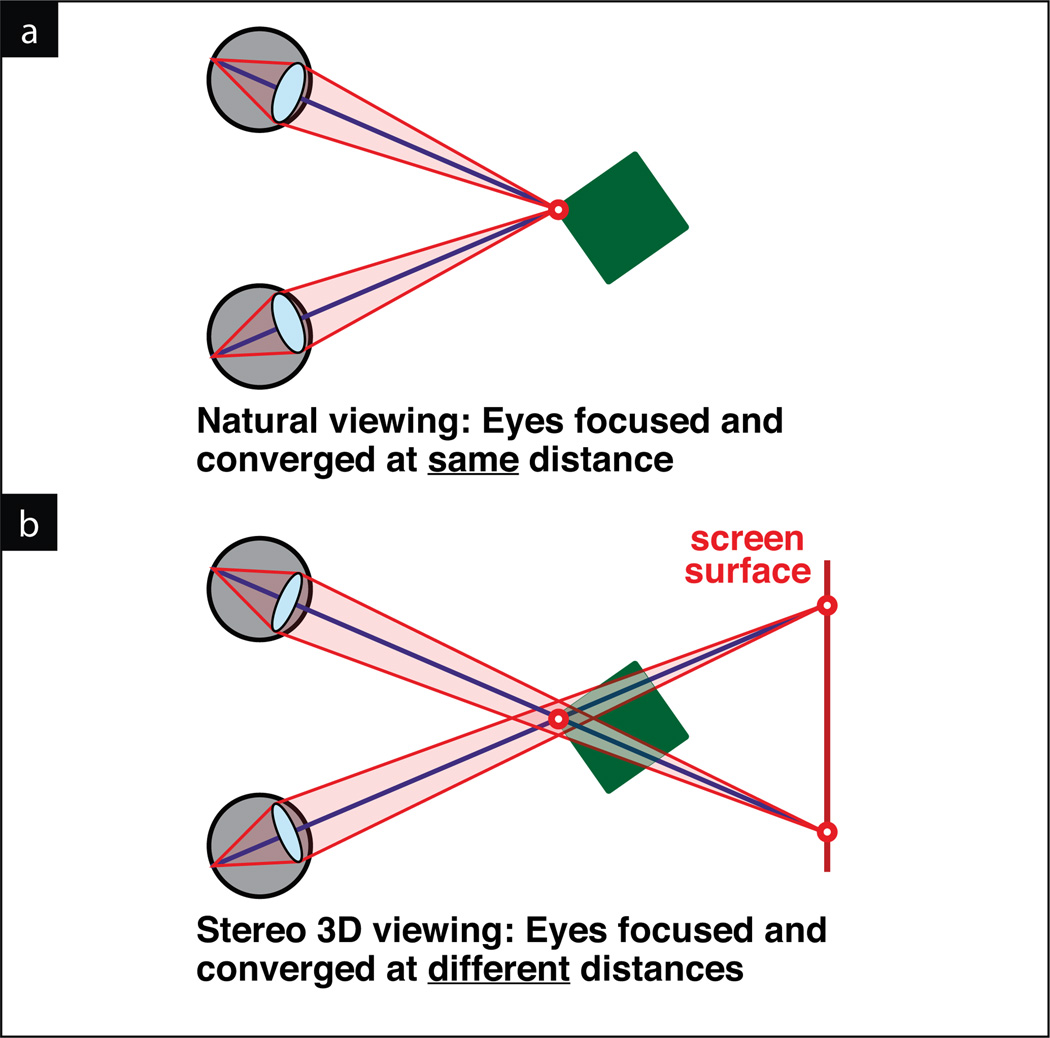
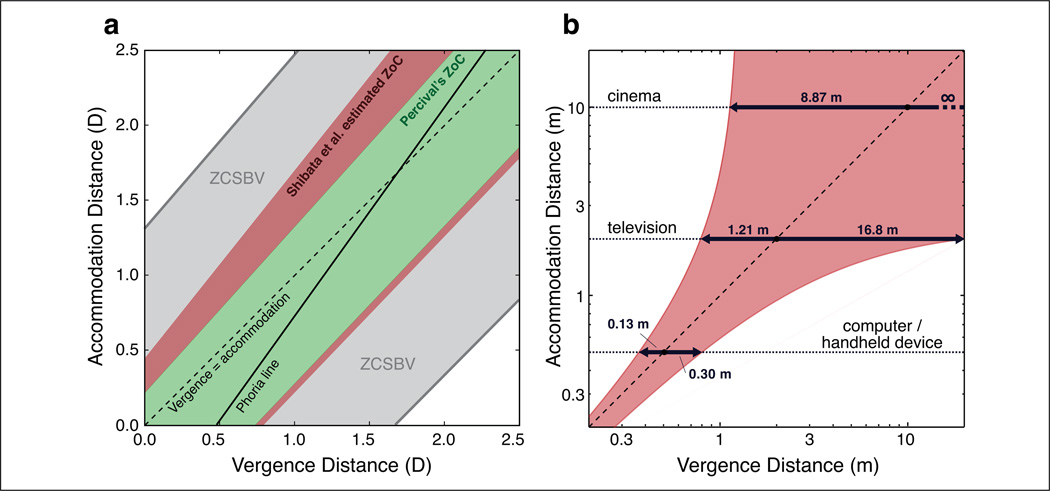
Stereoscopic displays have become important for many applications, including operation of remote devices, medical imaging, surgery, scientific visualization, and computer-assisted design. But the most significant and exciting development is the incorporation of stereo technology into entertainment: specifically, cinema, television, and video games. In these applications for stereo, three-dimensional (3D) imagery should create a faithful impression of the 3D structure of the scene being portrayed. In addition, the viewer should be comfortable and not leave the experience with eye fatigue or a headache. Finally, the presentation of the stereo images should not create temporal artifacts like flicker or motion judder. This paper reviews current research on stereo human vision and how it informs us about how best to create and present stereo 3D imagery. The paper is divided into four parts: (1) getting the geometry right, (2) depth cue interactions in stereo 3D media, (3) focusing and fixating on stereo images, and (4) how temporal presentation protocols affect flicker, motion artifacts, and depth distortion.


Figures

Figure 1
Figure 1
A visual scene as a miniature model in front of the viewer.
Figure 2
Figure 2
An object in space and the centers of projection of the eyes define an epipolar plane. If the screen displaying the S3D content contains a vector parallel to the interocular axis, then the intersection of this plane with the screen is also parallel to the interocular axis. In the usual case, where the interocular axis is horizontal, this means that to reproduce the disparity of the real object, its two images must have zero vertical parallax. Their horizontal parallax depends on how far the simulated object is in front of or behind the screen.
Figure 3
Figure 3
Different eye postures cause characteristic patterns of vertical disparity on the retina, largely independent of the scene viewed. Here, the eyes view an array of points on a grid in space, directly in front of the viewer. The eyes are not converged, so the points have a large horizontal disparity on the retina. (a) The eyes have a vertical vergence misalignment. This introduces a constant vertical disparity across the retina. (b) The eyes are slightly cyclodiverged (rotated in opposite directions about the lines of sight). This introduces a shearlike pattern of vertical disparity across the retina.
Figure 4
Figure 4
Passive stereo in which left and right images that are displayed on different pixel rows (a) can introduce vertical parallax but (b) need not do so if created appropriately.
Figure 5
Figure 5
Vertical parallax introduced by camera convergence.
Figure 6
Figure 6
Mapping from disparity to depth depends on the convergence angle. In both panels, the eyes are fixating on the purple sphere. The retinal disparity between the two spheres is the same in both panels. (a) The sphere is close, so the eyes are more strongly converged. (b) The physical distance the eyes map onto is much larger when the convergence angle is smaller.
Figure 7
Figure 7
Filming with parallel camera axes.
Figure 8
Figure 8
Ambiguity in perspective projection. (a) A perspective projection is compatible with many real scenes, including a drawing of a 2D surface. (b) Even occlusion can be ambiguous if it is uncertain which surface is the occluder.
Figure 9
Figure 9
Cue combination. Curves show the likelihood of a given depth value (horizontal axis) provided by two cues and the MLE combination (all normalized for unit area). (a) When the estimates of the two cues are similar, the weighted combination gives a more precise estimate. (b) When bias is large, the cue combination may not be consistent with either cue.
Figure 10
Figure 10
Use of lighting to enhance the perception of depth. Top and bottom stereo pairs are arranged for cross-eyed fusion and have the same camera parameters. The top pair has high-contrast lighting; the bottom has flat lighting. Viewers generally report that the top pair has more depth than the bottom pair.
Figure 11
Figure 11
The vergence–accommodation conflict in stereoscopic displays. (a) In natural viewing, vergence and accommodation are to the same distance. (b) In stereo displays, these two oculomotor responses must be decoupled for the viewer to have clear, single binocular vision.
Figure 12
Figure 12
ZoC. (a) Plot of accommodation distance as a function of vergence distance, both in diopters. The estimate of the ZCSBV is in gray, Percival’s ZoC is in green, and the estimate of the ZoC for S3D viewing from Shibata et al.64 is in red. The phoria line for a typical viewer is also shown. (b) ZoC from Shibata et al. when plotted in units of distance rather than diopters. The horizontal lines represent the typical viewing distances for various common devices.
Figure 13
Figure 13
Temporal protocols used in S3D displays. The columns represent different protocols. In the upper row, each panel plots the position of stimulus moving at constant speed in the plane of the screen as a function of time. Red and blue line segments represent the presentations of the images to the left and right eyes, respectively. The arrows indicate the times at which the stimulus was captured (or computed). Black arrows indicate left and right images captured simultaneously. Red and blue arrows indicate left and right images captured in alternating fashion. Black diagonal lines represent the correct positions for the left and right images as a function of time. In the lower row, each panel plots disparity as a function of time. Black horizontal lines represent the correct disparities. Black dots represent the disparities when the two eyes’ images are presented simultaneously. Green dots represent the disparities that would be calculated if the left-eye image is matched to the successive right-eye image and the right-eye image is matched to the successive left-eye image. Dashed horizontal lines represent the time-average disparities that would be obtained by such matching. Wherever a horizontal line is not visible, the average disparity is the same as the correct disparity, so the two lines superimpose.
Figure 14
Figure 14
Properties of a smoothly moving stimulus and a stroboscopic stimulus. (a) The gray diagonal line represents the motion of a smoothly moving vertical line on axes of time and horizontal position. The green dots represent the stroboscopic presentation of that stimulus; brief flashes occur at multiples of Δt. (b) Fourier transform (technically the amplitude spectrum) for the smoothly moving and stroboscopic stimuli plotted on axes of temporal frequency (in cycles per second or hertz) and spatial frequency (in cycles per degree). The black diagonal line represents the temporal and spatial frequencies of the smoothly moving stimulus. Green lines are the additional frequencies from the stroboscopic stimulus; they are temporal aliases separated by τp = 1/Δt. The ellipse contains combinations of temporal and spatial frequency that are visible to the visual system. The highest visible temporal frequency is indicated by cff, and the highest visible spatial frequency is indicated by va. The shaded region contains combinations of temporal and spatial frequency that are not visible.
Figure 15
Figure 15
The human spatiotemporal CSF. The sensitivity to a moving sinusoidal grating is plotted as a function of temporal frequency and spatial frequency. Sensitivity is the reciprocal of the contrast required to detect the stimulus and is represented by gray scale; brighter values corresponding to higher sensitivity. Adapted from Kelly.
Figure 16
Figure 16
Properties of stimuli presented with multiple-flash protocols. (a) Schematization of the single-, double-, and triple-flash protocols. In each case, the same images are presented during the interval tc until updated images are presented in the next interval. In multiflash protocols, the duration of each image presentation tp is tc/f, where f is the number of flashes. (b) Corresponding Fourier transforms of the multiflash stimuli plotted as a function of temporal and spatial frequency. The transform of a smoothly moving real stimulus is again a diagonal line with the slope −1/s. Amplitude is represented by gray scale, with dark values corresponding to higher amplitudes. The presentation rate tp (or 1/tp) is indicated by arrows. The aliases are separated by tc (1/tp), which is also indicated by arrows. The circles represent the window of visibility.
Figure 17
Figure 17
Distortions of perceived depth with simultaneous capture and alternating presentation. The disparity distortion is plotted as a function of the speed of a stimulus moving in the plane of the display screen. (a) Data from protocols with a 25 Hz capture rate. Purple circles represent the data with the single-flash protocol (Csim/Palt−1X). Blue circles represent the data with the double-flash protocol (Csim/Palt−2X). Red asterisks represent the data from the tripleflash protocol (Csim/Palt−3X). The predictions for the time-average disparity model (lower row of Fig. 13) are the dashed lines with the colors corresponding to the appropriate temporal protocol. (b) Data from the same protocols, but with different capture rates. In each case, the presentation rate was 75 Hz, so the right eye’s image was delayed relative to the left eye’s image by 1/150 sec. The predictions for the time-average model are the dashed line. Cyan circles, green circles, and red asterisks are the data from the single-, double-, and triple-flash protocols, respectively.

References

    1. Allison RS. Analysis of the Influence of Vertical Disparities Arising in Toed-In Stereoscopic Cameras. J. Imag. Sci. Tech. 2007;51:317–327.
    1. Allison RS, Howard IP, Fang X. Depth Selectivity of Vertical Fusional Mechanisms. Vision Res. 2000;40:2985–2998. - PubMed
    1. Howard IP, Allison RS, Zacher JE. The Dynamics of Vertical Vergence. Exp. Brain Res. 1997;116:153–159. - PubMed
    1. Howard IP, Fang X, Allison RS, Zacher JE. Effects of Stimulus Size and Eccentricity on Horizontal and Vertical Vergence. Exp. Brain Res. 2000;130:124–132. - PubMed
    1. Rogers BJ, Bradshaw MF. Disparity Minimisation, Cyclovergence, and the Validity of Nonius Lines as a Technique for Measuring Torsional Alignment. Perception. 1999;28:127–141. - PubMed

LinkOut - more resources