. 2012;8(11):e1003002.
doi: 10.1371/journal.ppat.1003002. Epub 2012 Nov 8.

Early mechanisms of pathobiology are revealed by transcriptional temporal dynamics in hippocampal CA1 neurons of prion infected mice

Affiliations

Early mechanisms of pathobiology are revealed by transcriptional temporal dynamics in hippocampal CA1 neurons of prion infected mice

Anna Majer et al. PLoS Pathog. 2012.

Abstract

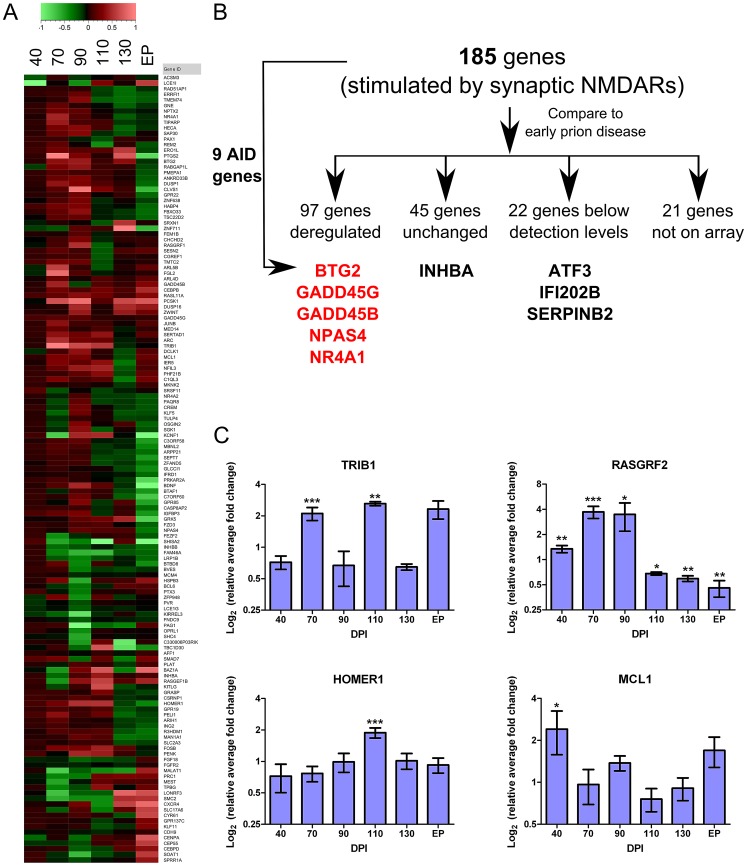
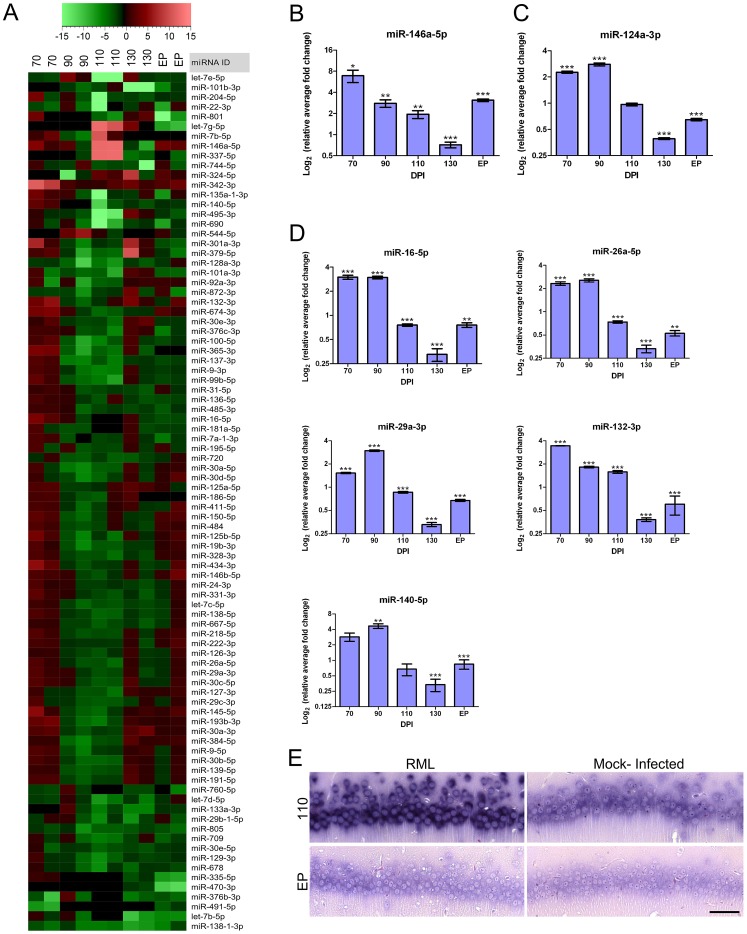
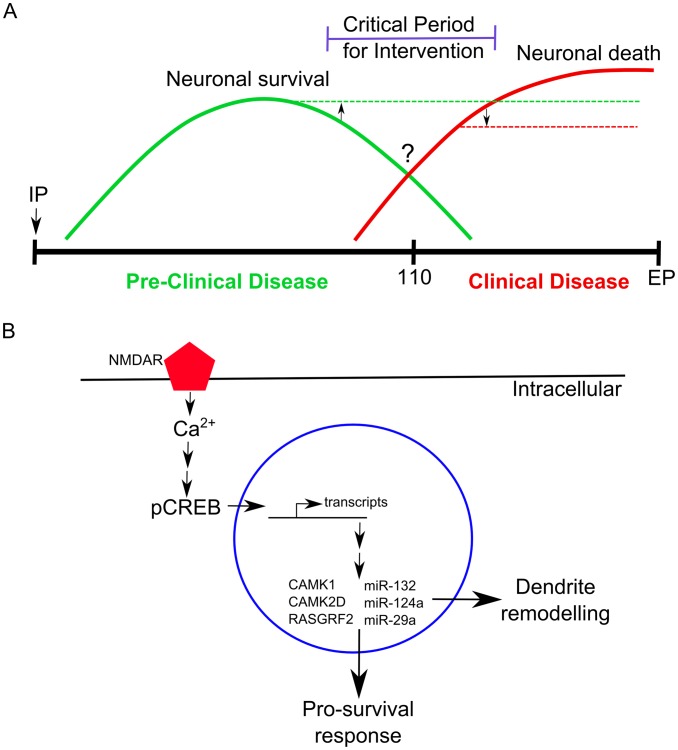
Prion diseases typically have long pre-clinical incubation periods during which time the infectious prion particle and infectivity steadily propagate in the brain. Abnormal neuritic sprouting and synaptic deficits are apparent during pre-clinical disease, however, gross neuronal loss is not detected until the onset of the clinical phase. The molecular events that accompany early neuronal damage and ultimately conclude with neuronal death remain obscure. In this study, we used laser capture microdissection to isolate hippocampal CA1 neurons and determined their pre-clinical transcriptional response during infection. We found that gene expression within these neurons is dynamic and characterized by distinct phases of activity. We found that a major cluster of genes is altered during pre-clinical disease after which expression either returns to basal levels, or alternatively undergoes a direct reversal during clinical disease. Strikingly, we show that this cluster contains a signature highly reminiscent of synaptic N-methyl-D-aspartic acid (NMDA) receptor signaling and the activation of neuroprotective pathways. Additionally, genes involved in neuronal projection and dendrite development were also altered throughout the disease, culminating in a general decline of gene expression for synaptic proteins. Similarly, deregulated miRNAs such as miR-132-3p, miR-124a-3p, miR-16-5p, miR-26a-5p, miR-29a-3p and miR-140-5p follow concomitant patterns of expression. This is the first in depth genomic study describing the pre-clinical response of hippocampal neurons to early prion replication. Our findings suggest that prion replication results in the persistent stimulation of a programmed response that is mediated, at least in part, by synaptic NMDA receptor activity that initially promotes cell survival and neurite remodelling. However, this response is terminated prior to the onset of clinical symptoms in the infected hippocampus, seemingly pointing to a critical juncture in the disease. Manipulation of these early neuroprotective pathways may redress the balance between degeneration and survival, providing a potential inroad for treatment.


Conflict of interest statement

The authors have declared that no competing interests exist.

Figures

Figure 1
Figure 1. The distribution of resident immune cells in the CA1 hippocampal region of both control and prion infected mice.
(A) The expression levels of microglia (AIF1) and astrocyte (GFAP) cell markers determined by microarrays in both control and infected samples. The bars represent log signal intensity values where dark gray bars indicate infected samples while light gray bars represent control levels of AIF1. Statistical significance was calculated by the Student's t-test where * reflects a p-value≤0.05 and ** for p-value≤0.01. The AIF1 log fold change is plotted as a line graph. The red bar reflects GFAP signal in prion infected sample as we did not detect any signal in control samples. The horizontal dotted red line represents the signal intensity threshold set at 100. (B) Immunoflourescence images for both control and infected mice at 70 and EP times post infection showing the presence of GFAP (red) within the CA1 nuclear cell layer (blue). Scale bar reflects a 50 µm region. (C) Representative immunohistochemistry images of microglial CA1 regions of control and prion infected samples. Images represent 70 and end point (EP) DPIs showing microglial cells stained brown contrasted against the blue nuclear stain. Scale bar reflects a 50 µm region. (D) The quantified presence of microglia in control and prion infected samples during the course of disease. The star for the DPI 90 time point indicates insufficient replicates for accurate statistical analysis. Statistical significance was calculated by the Student's t-test; ns means no significance; * for a p-value of ≤0.05 and ** for a p-value of ≤0.0005.
Figure 2
Figure 2. The overall neuronal architecture of the CA1 hippocampal region and the localization of PrPRes deposits during prion disease.
(A) The gene expression levels of 3 neuronal markers (NEFL, NEM and SNAP25) in control and prion infected samples. The bars represent log signal intensity values where dark gray bars indicate infected samples while light gray bars represent control levels for each specified gene. Significance was calculated by the Student's t-test where * represents a p-value≤0.05; ** reflects a p-value≤0.01 and *** stands for a p-value≤0.001. The log fold change is plotted as a line graph for each gene. The horizontal dotted red line represents the signal intensity threshold set at 100. (B) Neuronal degeneration was identified by staining hippocampal regions with FlouroJadeC at late (EP DPI) stages of prion disease. The large images represent the hippocampal region (scale bar represents 200 µm) while the outlined rectangles represent the regions that are further magnified (scale bar is 50 µm). CA1, cornu ammonis 1; DG, dentate gyrase; SR, stratum radiatum; SLM, stratum lacunosum-moleculare. (C) The localization of PrPRes deposits in the hippocampal region at early (90 and 110 DPI) and late stages of disease (EP). Brown staining represents PrP presence while blue shows nuclear staining. Arrows indicate some of the PrPRes deposits that were identified throughout disease progression.
Figure 3
Figure 3. A dynamic temporal gene expression profile identified between prion infected and control samples.
(A) Hierarchical clustering of 1026 genes that showed significant differential expression across time between the prion-infected and mock-infected control groups (ctrl; FDR<0.001 and at least two fold change). Red indicates increased and blue indicates decreased expression levels relative to the mean (white). The two circles highlight the “waves” of genes that are temporally deregulated during prion disease. (B) Gene ontology networks for up-regulated genes are grouped according to the indicated time points analyzed. Select ontologies are highlighted of which majority reflect immune-regulated genes at late stages of disease. The gene ontology involved in the stress response is highlighted by a red * that occurs at 70 DPI. (C) Gene ontology networks for down-regulated genes are grouped according to the indicated time points analyzed. Select ontologies are highlighted for which majority reflect neuronal-specific gene function.
Figure 4
Figure 4. Immunohistochemical detection of CREB in CA1 hippocampal neurons reveals an up-regulation of the phosphorylated form of the protein during early prion disease.
(A) Immunohistochemical representation of total CREB levels at 70 and EP post infection in either RML or mock-infected animals. Brown staining represents CREB levels against the blue stained nuclei. Scale bar represents 50 µm. (B) Quantitative assessment of CREB levels by comparing RML infected and control CA1 hippocampal samples throughout prion disease progression. The star represents insufficient replicates for statistical purposes. (C) Representative immunohistochemistry images of pCREB at pre-clinical (110 DPI) and clinical (EP DPI) prion disease. Brown staining represents pCREB between RML infected and control samples. Scale bar represents a 50 µm region. (D) Quantitative assessment of all sections for pCREB were taken at each time point with Student's t-test statistic; * for a p-value of ≤0.05 and *** for a p-value of ≤0.0001.
Figure 5
Figure 5. Genes deregulated during early prion disease suggest the stimulation of a neuroprotective mechanism.
(A) A hierarchical plot of the 141 neuronal activity-regulated genes identified by Zhang and colleagues that we also found deregulated during early prion disease in CA1 hippocampal regions. Legend describes the log fold change. (B) The detailed distribution of the genes we found deregulated in prion infection as compared to the list of 185 neuronal activity-regulated genes. From these initial 185 gene list, 9 genes were a core set of neuroprotective genes termed Activity-regulated Inhibitor of Death (AID) genes that are further highlighted in either red or black. Red represents an up-regulation while black represents either unchanged or not detected expression in prion infected samples. (C) Real-time PCR validation of 4 genes from the 185 gene list showing log2 ratio of relative average fold change over days post infection (DPI). Significance was calculated by the Student's t-test statistic where * was a p-value of ≤0.05; ** was a p-value of ≤0.01 and *** was a p-value of ≤0.001.
Figure 6
Figure 6. Global miRNA expression profile identified throughout prion infection further highlights a temporal dynamic in disease.
(A) A hierarchical cluster plot showing fold changes of prion-infected as compared to control samples throughout the disease process. Legend indicates the fold change. (B) The validated miRNA-146a-5p expression profile during prion disease in the CA1 hippocampal region where * indicates a p-value≤0.1; ** reflects p-value≤0.05; *** represents p-value≤0.01 (n≥3). (C) Real-time PCR validation assay of miR-124a-3p throughout prion infection where * indicates a p-value≤0.1; ** reflects p-value≤0.05; *** represents p-value≤0.01 (n≥3). (D) Validation of 5 additional miRNAs using real-time PCR: miR-16-5p, miR-26a-5p, miR-29a-3p, miR-132-3p and miR-140-5p. Log2 of the relative average fold change is graphed against days post inoculation (DPI). Significance was determined using Student's t-test statistic where * represents a p-value≤0.1; ** represents a p-value≤0.05; *** represents a p-value of ≤0.01 (n≥3). (E) In situ hybridization of miR-132-3p in RML and control CA1 hippocampal samples at pre-clinical (110 DPI) and clinical (EP) prion disease. Dark blue/black staining shows the presence of miR-132-3p. Scale bar represents a 50 µm length.
Figure 7
Figure 7. A schematic representation of the molecular changes we observed in neurons during prion disease.
(A) A time-line showing the relative abundance of molecular signatures during pre-clinical and clinical prion disease in CA1 hippocampal neurons. Neuronal survival genes (solid green line) are most abundantly expressed during pre-clinical disease. At approximately 110 days post infection an unknown switch occurs (?) where neurons begin to elicit a death response (solid red line) which increases in abundance during clinical progression. A critical period exists for potential intervention strategies where targeting either the neuronal survival (upwards arrow and broken green line) or neuronal death mechanisms (downwards arrow and dashed red line) may help prolong disease onset. IP refers to the intraperitaneal inoculation route at 0 days post infection. (B) An example of molecular mechanisms that we observed to be affected during early prion disease. Synaptic NMDARs are stimulated, allowing for the influx of Ca2+ to enter the neuron which activates numerous signaling pathways one of which leads to the phosphorylation of CREB. The phosphorylated CREB activates transcription of many genes, including other transcription factors, within the nuclease resulting in the direct and indirect up-regulation of genes such as CAMK1, CAMK2D, RASGRF2, DOCK1 and microRNAs such as miR-132-3p, miR-124a-3p, miR-29a-3p. These effector molecules help neurons evoke a pro-survival response and stimulate dendrite remodeling mechanisms.

Similar articles

Cited by

References

    1. Jeffrey M, Halliday WG, Bell J, Johnston AR, MacLeod NK, et al. (2000) Synapse loss associated with abnormal PrP precedes neuronal degeneration in the scrapie-infected murine hippocampus. Neuropathol Appl Neurobiol 26: 41–54. - PubMed
    1. Cunningham C, Deacon R, Wells H, Boche D, Waters S, et al. (2003) Synaptic changes characterize early behavioural signs in the ME7 model of murine prion disease. Eur J Neurosci 17: 2147–2155. - PubMed
    1. Siskova Z, Page A, O'Connor V, Perry VH (2009) Degenerating synaptic boutons in prion disease: Microglia activation without synaptic stripping. Am J Pathol 175: 1610–1621. - PMC - PubMed
    1. Moreno JA, Radford H, Peretti D, Steinert JR, Verity N, et al. (2012) Sustained translational repression by eIF2alpha-P mediates prion neurodegeneration. Nature 485: 507–511. - PMC - PubMed
    1. Hwang D, Lee IY, Yoo H, Gehlenborg N, Cho JH, et al. (2009) A systems approach to prion disease. Mol Syst Biol 5: 252. - PMC - PubMed

Publication types