. 2012;8(11):e1003031.
doi: 10.1371/journal.pgen.1003031. Epub 2012 Nov 8.

A targeted glycan-related gene screen reveals heparan sulfate proteoglycan sulfation regulates WNT and BMP trans-synaptic signaling

Affiliations

A targeted glycan-related gene screen reveals heparan sulfate proteoglycan sulfation regulates WNT and BMP trans-synaptic signaling

Neil Dani et al. PLoS Genet. 2012.

Abstract

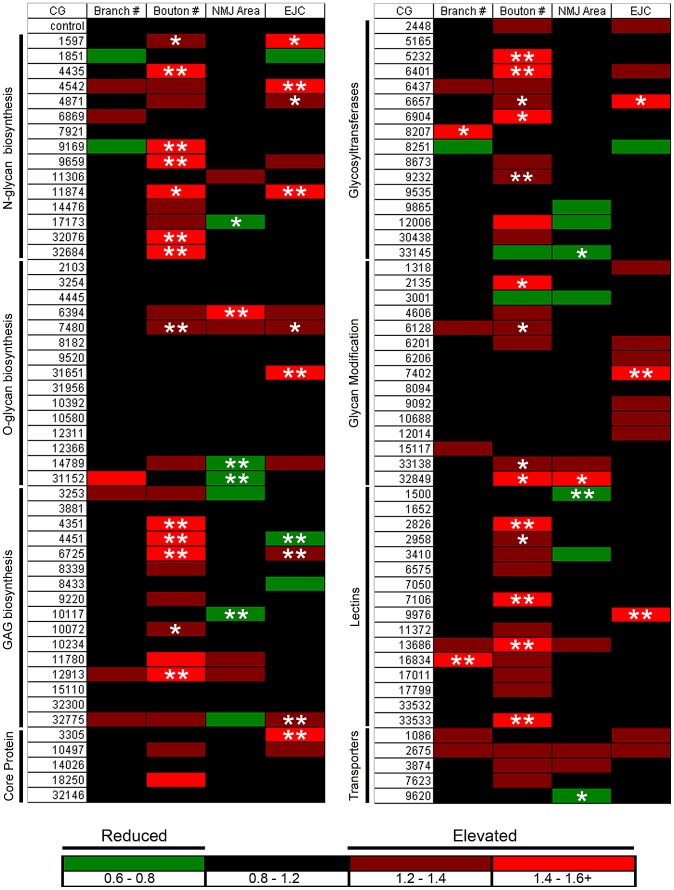
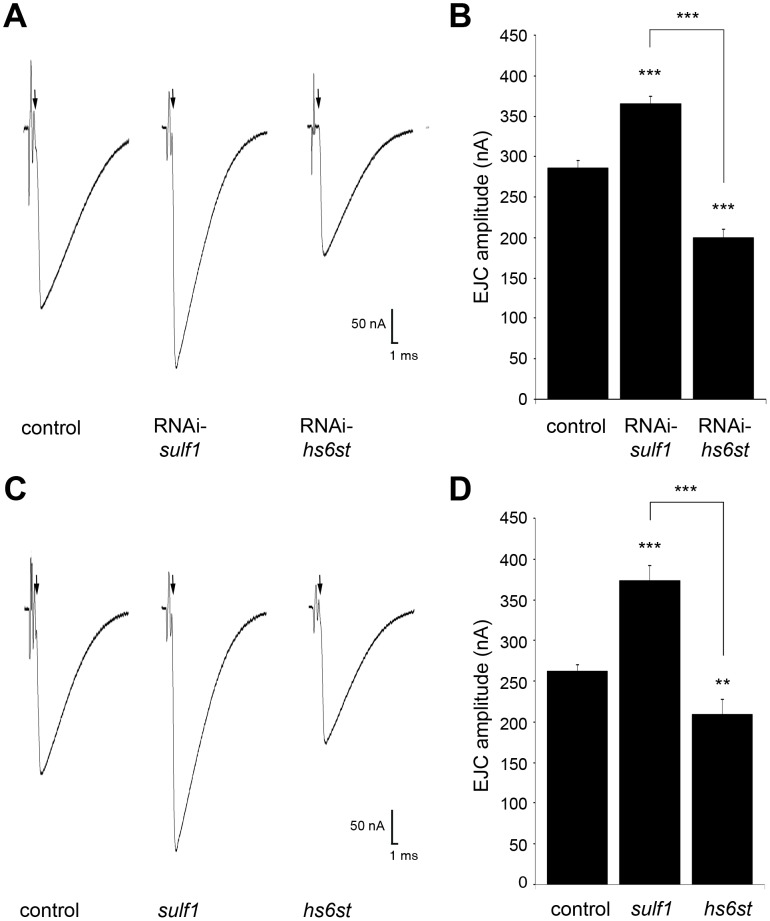
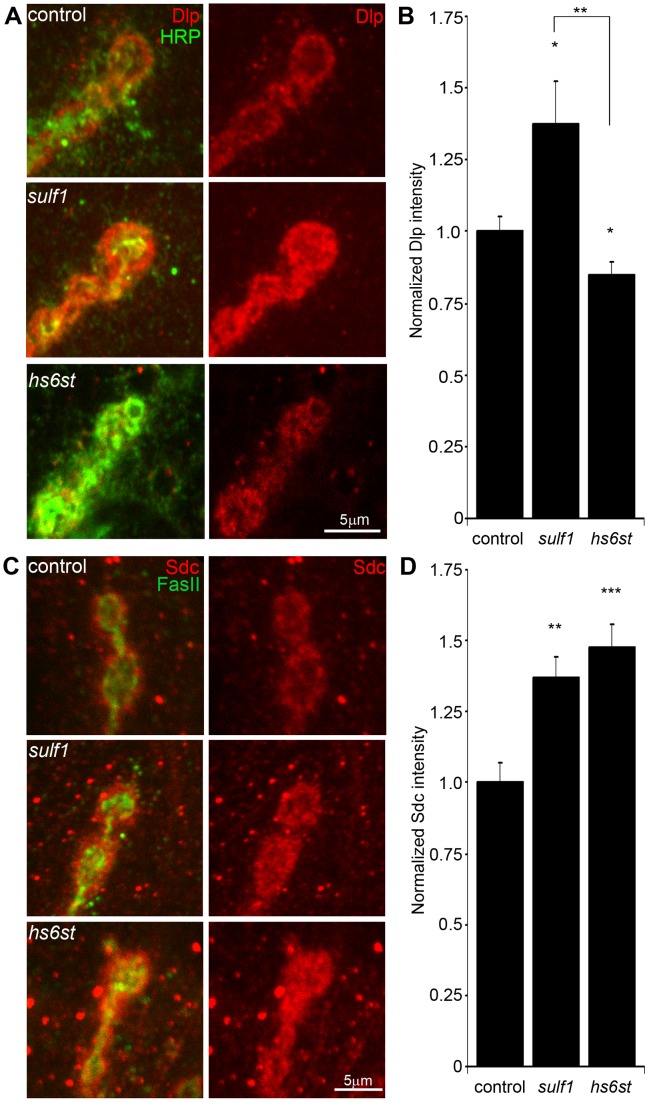
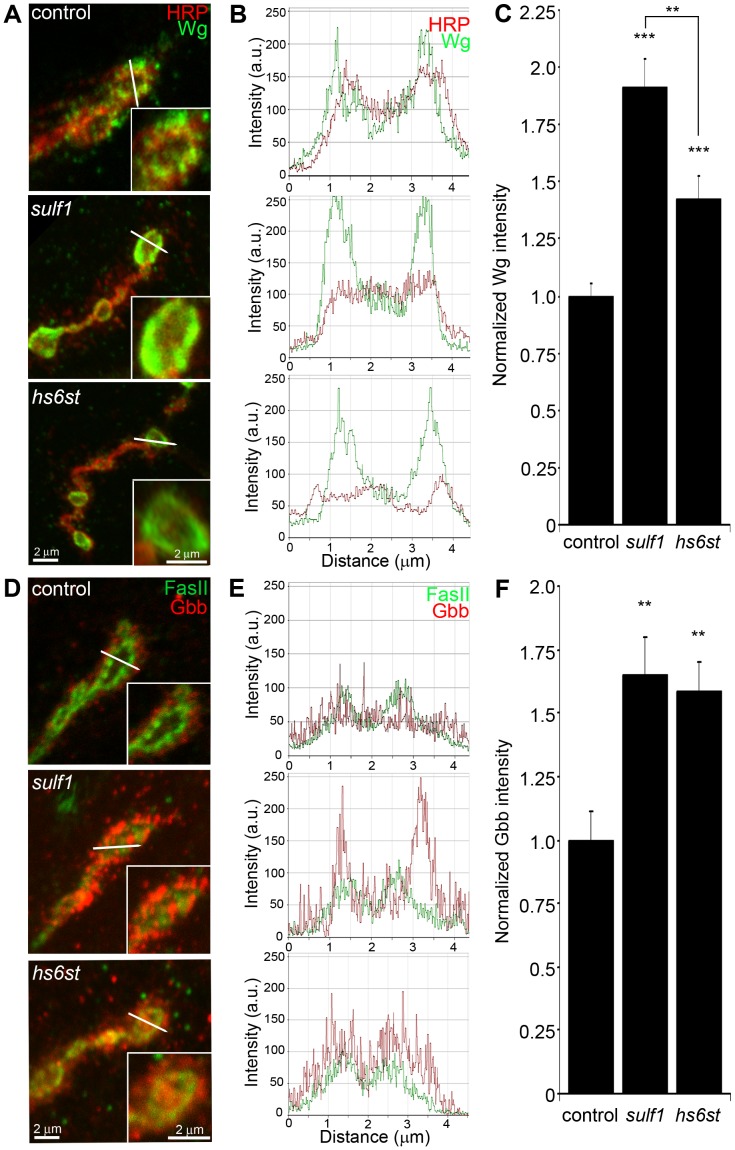
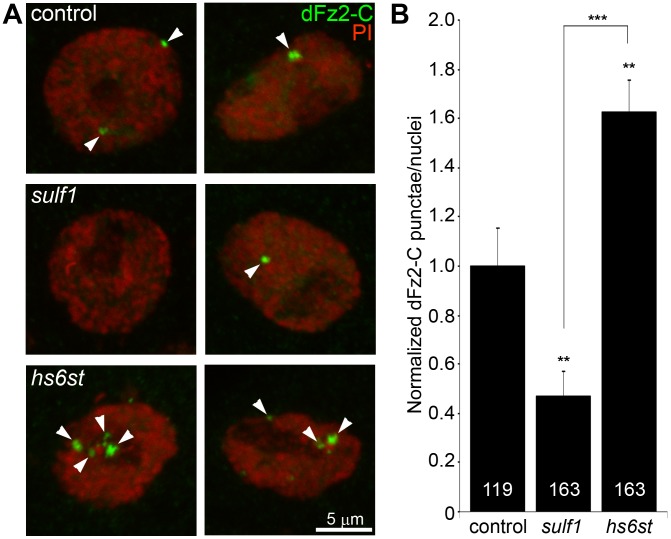
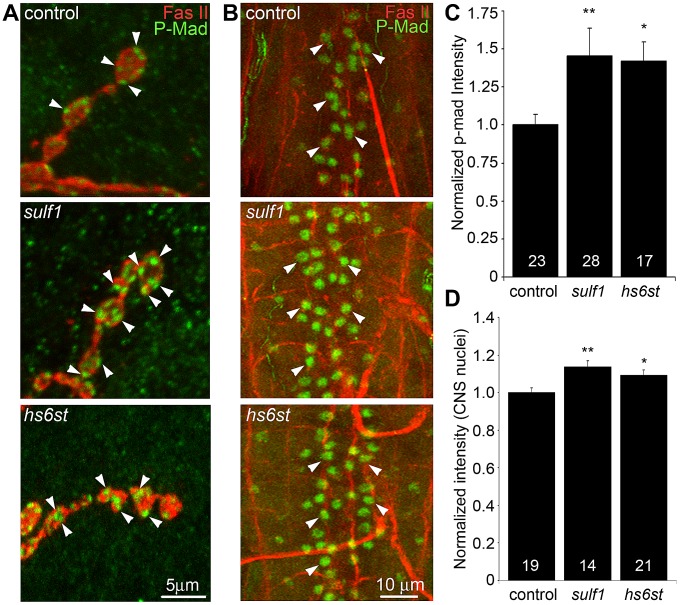
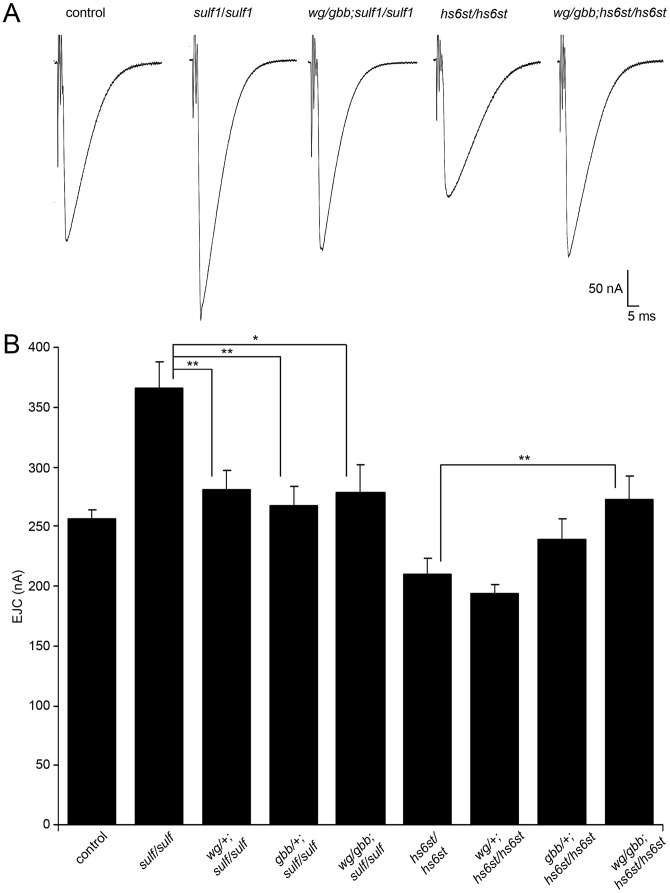
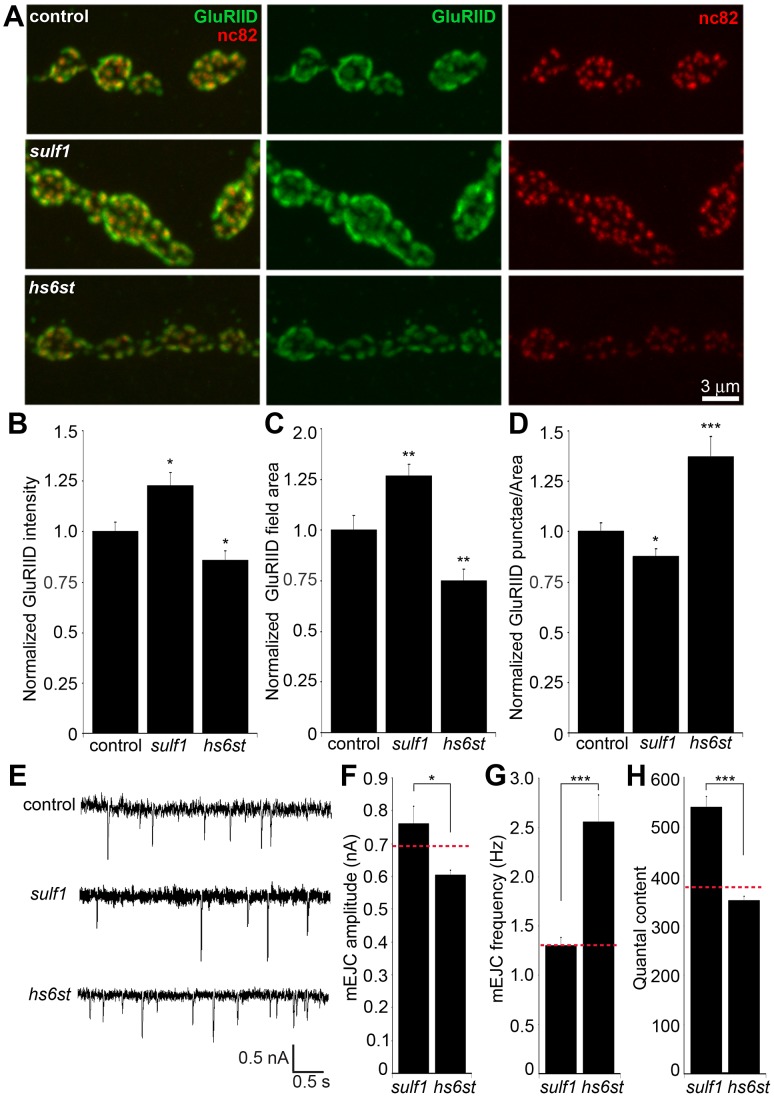
A Drosophila transgenic RNAi screen targeting the glycan genome, including all N/O/GAG-glycan biosynthesis/modification enzymes and glycan-binding lectins, was conducted to discover novel glycan functions in synaptogenesis. As proof-of-product, we characterized functionally paired heparan sulfate (HS) 6-O-sulfotransferase (hs6st) and sulfatase (sulf1), which bidirectionally control HS proteoglycan (HSPG) sulfation. RNAi knockdown of hs6st and sulf1 causes opposite effects on functional synapse development, with decreased (hs6st) and increased (sulf1) neurotransmission strength confirmed in null mutants. HSPG co-receptors for WNT and BMP intercellular signaling, Dally-like Protein and Syndecan, are differentially misregulated in the synaptomatrix of these mutants. Consistently, hs6st and sulf1 nulls differentially elevate both WNT (Wingless; Wg) and BMP (Glass Bottom Boat; Gbb) ligand abundance in the synaptomatrix. Anterograde Wg signaling via Wg receptor dFrizzled2 C-terminus nuclear import and retrograde Gbb signaling via synaptic MAD phosphorylation and nuclear import are differentially activated in hs6st and sulf1 mutants. Consequently, transcriptional control of presynaptic glutamate release machinery and postsynaptic glutamate receptors is bidirectionally altered in hs6st and sulf1 mutants, explaining the bidirectional change in synaptic functional strength. Genetic correction of the altered WNT/BMP signaling restores normal synaptic development in both mutant conditions, proving that altered trans-synaptic signaling causes functional differentiation defects.


Conflict of interest statement

The authors have declared that no competing interests exist.

Figures

Figure 1
Figure 1. Glycan-related gene RNAi screen for synapse structure/function defects.
Transgenic RNAi screen interrogating effects of glycan-related gene knockdown on the morphology and function of the Drosophila neuromuscular junction (NMJ) synapse. All VDRC UAS-RNAi lines were crossed to the UH1-GAL4 driver line. Target genes are indicated by Drosophila genome CG annotation number and categorized by function. Confocal imaging of co-labeled pre- and postsynaptic markers was used to quantify NMJ architecture, including branch number, bouton number and synaptic area. TEVC electrophysiology was used to quantify evoked excitatory junctional current (EJC) amplitudes. The magnitude of fold changes compared to control (w1118×UH1-GAL4) is shown on a color scale (see legend below the two columns). Statistical significance was calculated using one-way ANOVA analysis, and displayed as p<0.05 (*), p<0.01 (**).
Figure 2
Figure 2. Loss of sulf1/hs6st causes opposite effects on transmission strength.
(A) Representative excitatory junctional current (EJC) traces from control (w1118×UH1-GAL4), sulf1 RNAi (UH1-GAL4×UAS-CG6725) and hs6st RNAi (UH1-GAL4×UAS-CG4451). The nerve was stimulated (arrows) in 1.0 mM external Ca2+, with TEVC records (−60 mV holding potential) from muscle 6 in segment A3. Each trace averaged from 10 consecutive recordings. (B) Quantified mean EJC amplitudes (nA) for the three genotypes shown in panel A. (C) Representative traces from control (w1118), sulf1Δ1 and hs6std770 null alleles under the same conditions described in panel A. (D) Quantified mean EJC amplitudes (nA) for the three genotypes shown in panel C. Sample sizes are at least 11 animals per indicated genotype. Statistically significant differences calculated using student's t-test, ** p<0.01, *** p<0.001. Error bars indicate S.E.M.
Figure 3
Figure 3. Synaptic HSPG co-receptor abundance is modified by 6-O-S sulfation.
(A) Representative NMJ synaptic boutons imaged from control (w1118), sulf1 and hs6st nulls, probed with presynaptic neural marker anti-HRP (green) and Dally-like (Dlp; red). Right: Dlp distribution without the HRP signal is shown for clarity. (B) Quantification of mean fluorescent intensity levels of anti-Dlp labeling normalized to the HRP co-label at the muscle 6 NMJ, normalized to genetic control. (C) Boutons labeled with neural marker anti-Fasciclin II (FasII, green) and anti-Syndecan (Sdc, red). Right: Sdc distribution is shown alone for clarity. (D) Quantification of the mean fluorescent intensity levels of anti-Sdc labeling at the muscle 6 NMJ, normalized to genetic control. Sample sizes are at least 12 independent NMJs of at least 7 animals per indicated genotypes. Statistically significant differences calculated using student's t-test, * p<0.01, ** p<0.01, ***p<0.001. Error bars indicate S.E.M.
Figure 4
Figure 4. Synaptic WNT and BMP ligand abundance is modified by 6-O-S sulfation.
Images show muscle 6 NMJ in segment A3 probed in non-detergent conditions, so that only extracellular protein distributions are detected. The white lines indicate cross-section planes for spatial measurements. Insets indicate single synaptic boutons at higher magnification. (A) Representative NMJ boutons from control (w1118), sulf1 and hs6st null genotypes, labeled for presynaptic anti-horseradish peroxidase (HRP, red) and anti-wingless (Wg, green). (B) Extracellular distribution of Wg across the diameter of a synaptic bouton. The Y-axis indicates intensity and the X-axis shows distance in microns. The HRP intensity profile is indicated in red; Wg intensity is shown in green. (C) Quantification of Wg mean intensity levels normalized to the HRP co-label, and to genetic control. Sample sizes are at least 15 animals per indicated genotypes. (D) Representative synaptic boutons labeled with presynaptic anti-Fasciclin II (FasII; green) and anti-Glass Bottom Boat (Gbb; red). (E) Gbb distribution across the diameter of a synaptic bouton. Y-axis indicates intensity and the X-axis shows distance in microns. FasII intensity profile is indicated in green; Gbb intensity is shown in red. (F) Quantification of Gbb mean intensity levels normalized to genetic control. Sample sizes are at least 11 independent NMJs of at least 7 animals per indicated genotypes. Statistically significant differences calculated using student's t-test and Mann-Whitney test for non-parametric data, ** p<0.01, *** p<0.001. Error bars indicate S.E.M.
Figure 5
Figure 5. Loss of sulf1 and hs6st causes opposite effects on WNT signaling.
(A) Representative images of muscle nuclei from control (w1118), sulf1 and hs6st nulls, labeled with nuclear marker propidium iodide (PI, red) and for the C-terminus of the Wingless receptor Frizzled 2 (dFz2-C, green). Arrows indicate punctate dFz2-C nuclear labeling. Nuclei shown from muscle 6 in segment A3. (B) Quantification of the number of dFz2-C punctae per nuclei, normalized to genetic control. The total number of nuclei analyzed is indicated in each column; 119 for control (w1118) and 163 nuclei each for sulf1 and hs6st null mutants. Sample sizes are ≥9 animals per indicated genotypes. Statistically significant differences calculated using student's t-test; ** p<0.01 *** p<0.001. Error bars indicate S.E.M.
Figure 6
Figure 6. Loss of sulf1 and hs6st causes differential effects on BMP signaling.
(A) Representative NMJ synaptic boutons on muscle 6 in segment A3 from control (w1118), sulf1 and hs6st nulls, labeled with neural marker anti-Fasciclin II (FasII, red) and for phosphorylated Mothers against decapentaplegic (P-Mad; green) activated downstream of Gbb signaling. Arrows indicate representative P-Mad punctae in the indicated genotypes. (B) Representative ventral nerve cord (VNC) midlines from the same 3 genotypes, labeled with anti-FasII (red) and P-Mad (green). Labeled motor neuron nuclei are indicated by arrows. Quantification of the mean fluorescent intensity level of P-Mad labeling normalized to FasII co-label at the NMJ synapse (C) and in motor neuron nuclei (D), normalized to genetic control. Sample sizes are ≥14 animals per indicated genotypes. Statistically significant differences calculated using the Mann-Whitney test for non-parametric data, * p<0.05, ** p<0.01. Error bars indicate S.E.M.
Figure 7
Figure 7. WNT and BMP signals genetically interact with sulf1 and hs6st nulls.
Genetic reduction of Wg and Gbb levels in sulf1 and hs6st homozygous conditions restore EJC amplitudes to control levels. (A) Representative excitatory junctional current (EJC) traces from control (w1118), homozygous sulf1Δ1 null, heterozygous wg/+ and gbb/+ in sulf1 null background (wgI-12/gbb2; sulf1Δ1/sulf1Δ1), homozygous hs6std770 null and heterozygous wg/+ and gbb/+ in hs6st null background (wgI-12/gbb2; hs6std770/hs6std770). The nerve was stimulated (arrows) in 1.0 mM external Ca2+, and TEVC records (−60 mV holding potential) made from muscle 6 in segment A3. Each trace was averaged from 10 consecutive evoked EJC recordings. (B) Quantified mean EJC amplitudes (nA) for the nine genotypes shown. Sample sizes are ≥7 animals per indicated genotype. Statistically significant differences calculated using student's t-test, * p<0.05, ** p<0.01. Error bars indicate S.E.M.
Figure 8
Figure 8. Bi-directional effects of sulf1 and hs6st nulls on synaptic assembly.
(A) Representative NMJ boutons from control (w1118), sulf1 and hs6st null genotypes, labeled for postsynaptic Bad Reception (Brec) glutamate receptor IID subunit (GluRIID, green) and presynaptic active zone Bruchpilot (anti-nc82, red). Quantification of GluRIID mean fluorescent intensity (≥18 animals per indicated genotype) (B), GluRIID field area (≥40 boutons from ≥9 animals per indicated genotype) (C), and GluRIID punctae number per synaptic bouton (≥40 boutons from ≥9 animals per indicated genotype) (D), all normalized to genetic control. (E) Representative mEJC traces from control (w1118), sulf1Δ1 and hs6std770 null alleles. Quantified mean mEJC amplitude (nA) (F), mean mEJC frequency (Hz) (G) and mean quantal content (H), with genetic control levels indicated as a dotted red line in each case. Sample sizes ≥15 recordings per indicated genotype. Statistically significant differences calculated using student's t-test or Mann-Whitney test for non-parametric data and indicated as, * p<0.05, ** p<0.01, *** p<0.001. Error bars indicate S.E.M.

Similar articles

Cited by

References

    1. Iozzo RV (1998) Matrix proteoglycans: From molecular design to cellular function. Annual Review of Biochemistry 67: 609–652. - PubMed
    1. Varki A (2011) Evolutionary Forces Shaping the Golgi Glycosylation Machinery: Why Cell Surface Glycans Are Universal to Living Cells. Cold Spring Harbor Perspectives in Biology 3: a005462. - PMC - PubMed
    1. Kleene R, Schachner M (2004) Glycans and neural cell interactions. Nature Reviews Neuroscience 5: 195–208. - PubMed
    1. Dityatev A, Schachner M (2006) The extracellular matrix and synapses. Cell and Tissue Research 326: 647–654. - PubMed
    1. Varki A, Cummings RD, Esko JD, Freeze HH, Stanley P, et al.. (2009) Essentials of glycobiology. - PubMed

Publication types

MeSH terms

LinkOut - more resources