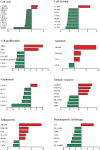
Differential gene expression profile associated with the abnormality of bone marrow mesenchymal stem cells in aplastic anemia
- PMID: 23144828
- PMCID: PMC3489901
- DOI: 10.1371/journal.pone.0047764
Differential gene expression profile associated with the abnormality of bone marrow mesenchymal stem cells in aplastic anemia
Abstract
Aplastic anemia (AA) is generally considered as an immune-mediated bone marrow failure syndrome with defective hematopoietic stem cells (HSCs) and marrow microenvironment. Previous studies have demonstrated the defective HSCs and aberrant T cellular-immunity in AA using a microarray approach. However, little is known about the overall specialty of bone marrow mesenchymal stem cells (BM-MSCs). In the present study, we comprehensively compared the biological features and gene expression profile of BM-MSCs between AA patients and healthy volunteers. In comparison with healthy controls, BM-MSCs from AA patients showed aberrant morphology, decreased proliferation and clonogenic potential and increased apoptosis. BM-MSCs from AA patients were susceptible to be induced to differentiate into adipocytes but more difficult to differentiate into osteoblasts. Consistent with abnormal biological features, a large number of genes implicated in cell cycle, cell division, proliferation, chemotaxis and hematopoietic cell lineage showed markedly decreased expression in BM-MSCs from AA patients. Conversely, more related genes with apoptosis, adipogenesis and immune response showed increased expression in BM-MSCs from AA patients. The gene expression profile of BM-MSCs further confirmed the abnormal biological properties and provided significant evidence for the possible mechanism of the destruction of the bone marrow microenvironment in AA.
Conflict of interest statement
Figures


Similar articles
-
Levamisole suppresses adipogenesis of aplastic anaemia-derived bone marrow mesenchymal stem cells through ZFP36L1-PPARGC1B axis.J Cell Mol Med. 2018 Sep;22(9):4496-4506. doi: 10.1111/jcmm.13761. Epub 2018 Jul 11. J Cell Mol Med. 2018. PMID: 29993187 Free PMC article.
-
Emodin suppresses adipogenesis of bone marrow derived mesenchymal stem cells from aplastic anemia via increasing TRIB3 expression.Tissue Cell. 2024 Feb;86:102287. doi: 10.1016/j.tice.2023.102287. Epub 2023 Dec 10. Tissue Cell. 2024. PMID: 38086146
-
Functional and Immune Modulatory Characteristics of Bone Marrow Mesenchymal Stromal Cells in Patients With Aplastic Anemia: A Systematic Review.Front Immunol. 2022 Mar 9;13:859668. doi: 10.3389/fimmu.2022.859668. eCollection 2022. Front Immunol. 2022. PMID: 35355996 Free PMC article.
-
CD106 is a novel mediator of bone marrow mesenchymal stem cells via NF-κB in the bone marrow failure of acquired aplastic anemia.Stem Cell Res Ther. 2017 Aug 1;8(1):178. doi: 10.1186/s13287-017-0620-4. Stem Cell Res Ther. 2017. PMID: 28764810 Free PMC article. Clinical Trial.
-
[Defectiveness of bone marrow mesenchymal stem cells in acquired aplastic anemia].Zhongguo Dang Dai Er Ke Za Zhi. 2015 Jan;17(1):100-6. Zhongguo Dang Dai Er Ke Za Zhi. 2015. PMID: 25616306 Review. Chinese.
Cited by
-
miR‑30a‑5p induces the adipogenic differentiation of bone marrow mesenchymal stem cells by targeting FAM13A/Wnt/β‑catenin signaling in aplastic anemia.Mol Med Rep. 2022 Jan;25(1):27. doi: 10.3892/mmr.2021.12543. Epub 2021 Nov 25. Mol Med Rep. 2022. PMID: 34821370 Free PMC article.
-
Yin and Yang of mesenchymal stem cells and aplastic anemia.World J Stem Cells. 2017 Dec 26;9(12):219-226. doi: 10.4252/wjsc.v9.i12.219. World J Stem Cells. 2017. PMID: 29321823 Free PMC article. Review.
-
Expression profiling of genes in rheumatoid fibroblast-like synoviocytes regulated by tumor necrosis factor-like ligand 1A using cDNA microarray analysis.Biomed Rep. 2019 Jul;1(1):1-5. doi: 10.3892/br.2019.1216. Epub 2019 May 22. Biomed Rep. 2019. PMID: 31258900 Free PMC article.
-
Multifaceted characterization of the signatures and efficacy of mesenchymal stem/stromal cells in acquired aplastic anemia.Stem Cell Res Ther. 2020 Feb 13;11(1):59. doi: 10.1186/s13287-020-1577-2. Stem Cell Res Ther. 2020. PMID: 32054519 Free PMC article.
-
PPAR Gamma-Regulated MicroRNA 199a-5p Underlies Bone Marrow Adiposity in Aplastic Anemia.Mol Ther Nucleic Acids. 2019 Sep 6;17:678-687. doi: 10.1016/j.omtn.2019.07.005. Epub 2019 Jul 19. Mol Ther Nucleic Acids. 2019. PMID: 31400610 Free PMC article.
References
-
- Li JP, Zheng CL, Han ZC (2010) Abnormal immunity and stem/progenitor cells in acquired aplastic anemia. Crit Rev Oncol Hematol 75: 79–93. - PubMed
-
- Verma A, Deb DK, Sassano A, Kambhampati S, Wickrema A, et al. (2002) Cutting edge: activation of the p38 mitogen-activated protein kinase signaling pathway mediates cytokine-induced hemopoietic suppression in aplastic anemia. J Immunol 168: 5984–5988. - PubMed
-
- Sloand E, Kim S, Maciejewski JP, Tisdale J, Follmann D, et al. (2002) Intracellular interferon-gamma in circulating and marrow T cells detected by flow cytometry and the response to immunosuppressive therapy in patients with aplastic anemia. Blood 100: 1185–1191. - PubMed
Publication types
MeSH terms
LinkOut - more resources
Full Text Sources
Other Literature Sources

