

A multi-population consensus genetic map reveals inconsistent marker order among maps likely attributed to structural variations in the apple genome
- PMID: 23144832
- PMCID: PMC3489900
- DOI: 10.1371/journal.pone.0047864
A multi-population consensus genetic map reveals inconsistent marker order among maps likely attributed to structural variations in the apple genome
Abstract
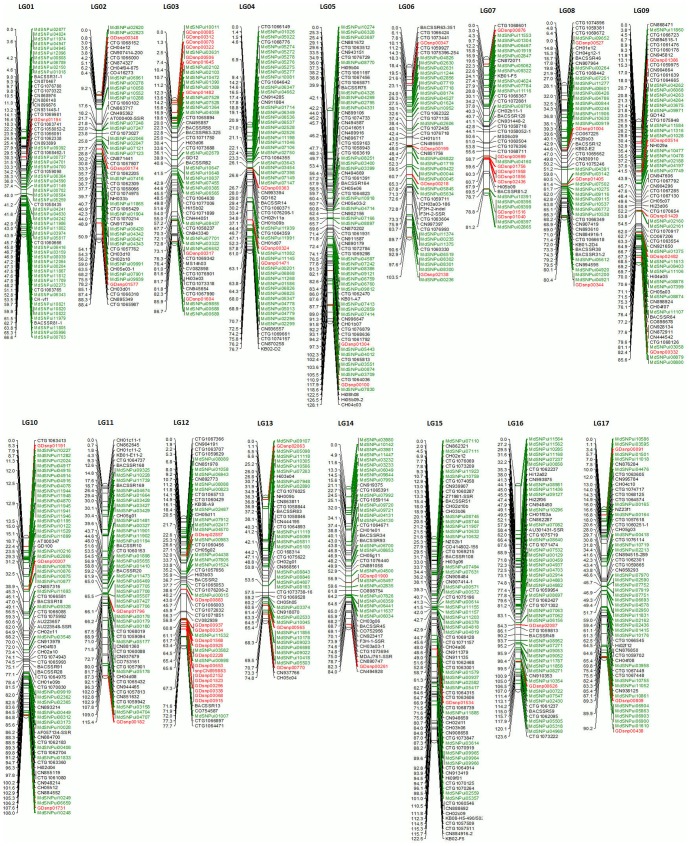
Genetic maps serve as frameworks for determining the genetic architecture of quantitative traits, assessing structure of a genome, as well as aid in pursuing association mapping and comparative genetic studies. In this study, a dense genetic map was constructed using a high-throughput 1,536 EST-derived SNP GoldenGate genotyping platform and a global consensus map established by combining the new genetic map with four existing reliable genetic maps of apple. The consensus map identified markers with both major and minor conflicts in positioning across all five maps. These major inconsistencies among marker positions were attributed either to structural variations within the apple genome, or among mapping populations, or genotyping technical errors. These also highlighted problems in assembly and anchorage of the reference draft apple genome sequence in regions with known segmental duplications. Markers common across all five apple genetic maps resulted in successful positioning of 2875 markers, consisting of 2033 SNPs and 843 SSRs as well as other specific markers, on the global consensus map. These markers were distributed across all 17 linkage groups, with an average of 169±33 marker per linkage group and with an average distance of 0.70±0.14 cM between markers. The total length of the consensus map was 1991.38 cM with an average length of 117.14±24.43 cM per linkage group. A total of 569 SNPs were mapped onto the genetic map, consisting of 140 recombinant individuals, from our recently developed apple Oligonucleotide pool assays (OPA). The new functional SNPs, along with the dense consensus genetic map, will be useful for high resolution QTL mapping of important traits in apple and for pursuing comparative genetic studies in Rosaceae.
Conflict of interest statement
Figures
References
-
- Han Y, Korban SS (2010) Strategies for map-based cloning in apple. Critical Reviews in Plant Sciences 29: 265–284.
-
- Khan MA, Korban SS (2012) Association mapping in forest trees and fruit crops. Journal of Experimental Botany doi:10.1093/jxb/ers105. - DOI - PubMed
-
- Khan MA, Zhao Y, Korban SS (2012a) Molecular mechanisms of pathogenesis and resistance to the bacterial pathogen Erwinia amylovora, causal agent of fire blight disease in Rosaceae. Plant Molecular Biology Reporter 30: 247–260.
-
- Darvasi A (1998) Experimental strategies for the genetic dissection of complex traits in animal models. Nature Genetics 18: 19–24. - PubMed
Publication types
MeSH terms
Substances
LinkOut - more resources
Full Text Sources
Research Materials
