

Genome-wide chromatin remodeling identified at GC-rich long nucleosome-free regions
- PMID: 23144837
- PMCID: PMC3489898
- DOI: 10.1371/journal.pone.0047924
Genome-wide chromatin remodeling identified at GC-rich long nucleosome-free regions
Abstract
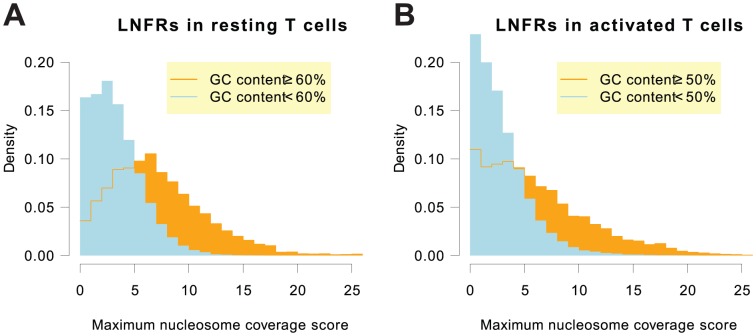
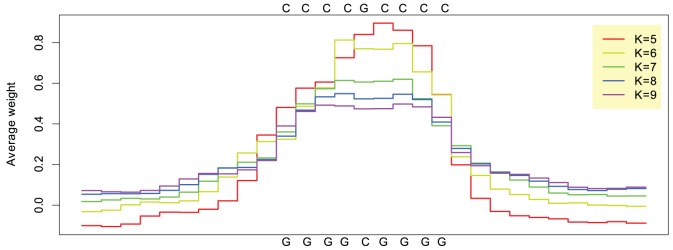
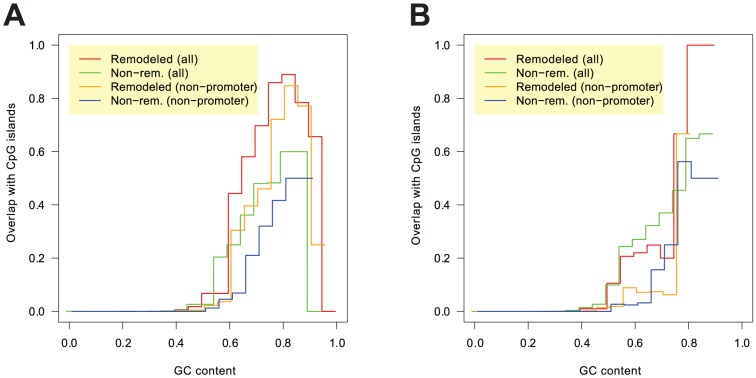
To gain deeper insights into principles of cell biology, it is essential to understand how cells reorganize their genomes by chromatin remodeling. We analyzed chromatin remodeling on next generation sequencing data from resting and activated T cells to determine a whole-genome chromatin remodeling landscape. We consider chromatin remodeling in terms of nucleosome repositioning which can be observed most robustly in long nucleosome-free regions (LNFRs) that are occupied by nucleosomes in another cell state. We found that LNFR sequences are either AT-rich or GC-rich, where nucleosome repositioning was observed much more prominently in GC-rich LNFRs - a considerable proportion of them outside promoter regions. Using support vector machines with string kernels, we identified a GC-rich DNA sequence pattern indicating loci of nucleosome repositioning in resting T cells. This pattern appears to be also typical for CpG islands. We found out that nucleosome repositioning in GC-rich LNFRs is indeed associated with CpG islands and with binding sites of the CpG-island-binding ZF-CXXC proteins KDM2A and CFP1. That this association occurs prominently inside and also prominently outside of promoter regions hints at a mechanism governing nucleosome repositioning that acts on a whole-genome scale.
Conflict of interest statement
Figures

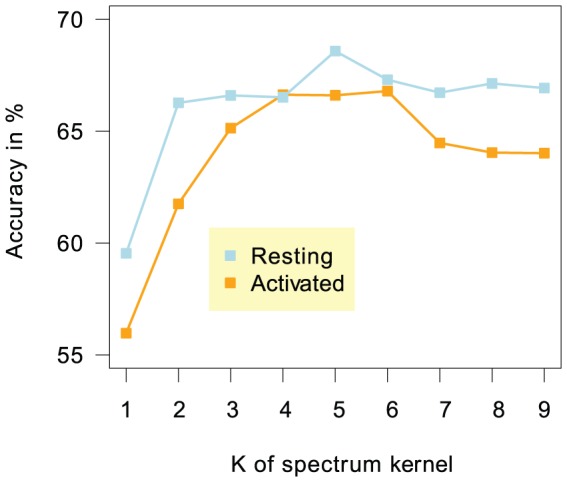
 , the sub-sequence length parameter of the spectrum kernel. For resting T cells, the accuracy peaks at
  , while
  's between 4 and 6 are best for classifying GC-rich remodeling LNFRs in activated T cells.
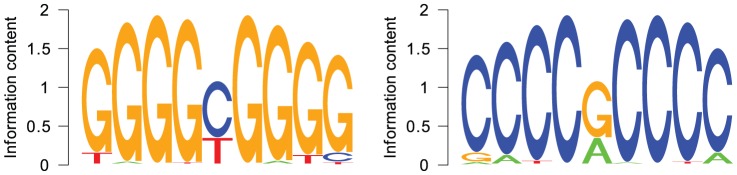
 .
.
 .
.
Similar articles
-
Genome-Wide Mapping Targets of the Metazoan Chromatin Remodeling Factor NURF Reveals Nucleosome Remodeling at Enhancers, Core Promoters and Gene Insulators.PLoS Genet. 2016 Apr 5;12(4):e1005969. doi: 10.1371/journal.pgen.1005969. eCollection 2016 Apr. PLoS Genet. 2016. PMID: 27046080 Free PMC article.
-
Recognition of CpG island chromatin by KDM2A requires direct and specific interaction with linker DNA.Mol Cell Biol. 2012 Jan;32(2):479-89. doi: 10.1128/MCB.06332-11. Epub 2011 Nov 14. Mol Cell Biol. 2012. PMID: 22083960 Free PMC article.
-
Contrasting chromatin organization of CpG islands and exons in the human genome.Genome Biol. 2010;11(7):R70. doi: 10.1186/gb-2010-11-7-r70. Epub 2010 Jul 5. Genome Biol. 2010. PMID: 20602769 Free PMC article.
-
CpG island chromatin is shaped by recruitment of ZF-CxxC proteins.Cold Spring Harb Perspect Biol. 2013 Nov 1;5(11):a018648. doi: 10.1101/cshperspect.a018648. Cold Spring Harb Perspect Biol. 2013. PMID: 24186071 Free PMC article. Review.
-
Control of nucleosome positions by DNA sequence and remodeling machines.Cell Biochem Biophys. 2008;51(2-3):67-80. doi: 10.1007/s12013-008-9015-6. Epub 2008 Jun 10. Cell Biochem Biophys. 2008. PMID: 18543113 Review.
Cited by
-
Characterizing and controlling intrinsic biases of lambda exonuclease in nascent strand sequencing reveals phasing between nucleosomes and G-quadruplex motifs around a subset of human replication origins.Genome Res. 2015 May;25(5):725-35. doi: 10.1101/gr.183848.114. Epub 2015 Feb 18. Genome Res. 2015. PMID: 25695952 Free PMC article.
-
Epigenetic switch at atp2a2 and myh7 gene promoters in pressure overload-induced heart failure.PLoS One. 2014 Sep 2;9(9):e106024. doi: 10.1371/journal.pone.0106024. eCollection 2014. PLoS One. 2014. PMID: 25181347 Free PMC article.
-
Reconstituted TAD-size chromatin fibers feature heterogeneous nucleosome clusters.Sci Rep. 2022 Sep 16;12(1):15558. doi: 10.1038/s41598-022-19471-3. Sci Rep. 2022. PMID: 36114220 Free PMC article.
-
The statistical-mechanics of chromosome conformation capture.Nucleus. 2013 Sep-Oct;4(5):390-8. doi: 10.4161/nucl.26513. Epub 2013 Sep 18. Nucleus. 2013. PMID: 24051548 Free PMC article. Review.
-
Transposable elements and G-quadruplexes.Chromosome Res. 2015 Sep;23(3):615-23. doi: 10.1007/s10577-015-9491-7. Chromosome Res. 2015. PMID: 26403244 Review.
References
-
- Kornberg RD, Lorch Y (1999) Twenty-five years of the nucleosome, fundamental particle of the eukaryote chromosome. Cell 98: 285–294. - PubMed
-
- Wyrick JJ, Holstege FC, Jennings EG, Causton HC, Shore D, et al. (1999) Chromosomal landscape of nucleosome-dependent gene expression and silencing in yeast. Nature 402: 418–421. - PubMed
-
- Anderson JD, Widom J (2000) Sequence and position-dependence of the equilibrium accessibility of nucleosomal DNA target sites. J Mol Biol 296: 979–987. - PubMed
-
- Lomvardas S, Thanos D (2002) Modifying gene expression programs by altering core promoter chromatin architecture. Cell 110: 261–271. - PubMed
-
- Simpson RT (1990) Nucleosome positioning can affect the function of a cis-acting DNA element in vivo. Nature 343: 387–389. - PubMed
MeSH terms
Substances
LinkOut - more resources
Full Text Sources
Miscellaneous
