

Phasor fluorescence lifetime microscopy of free and protein-bound NADH reveals neural stem cell differentiation potential
- PMID: 23144844
- PMCID: PMC3489895
- DOI: 10.1371/journal.pone.0048014
Phasor fluorescence lifetime microscopy of free and protein-bound NADH reveals neural stem cell differentiation potential
Abstract
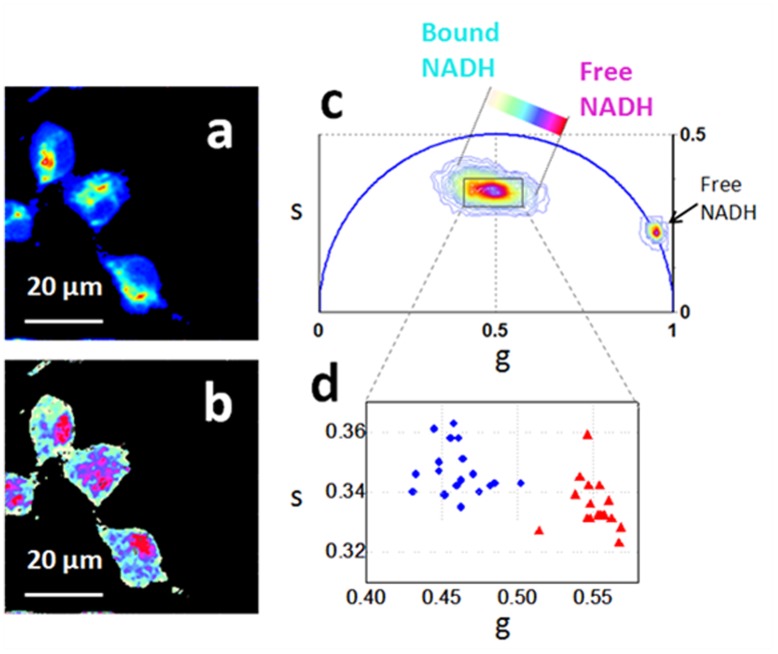
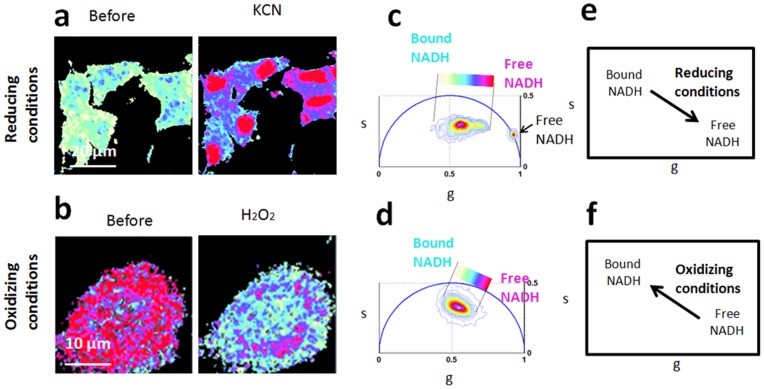
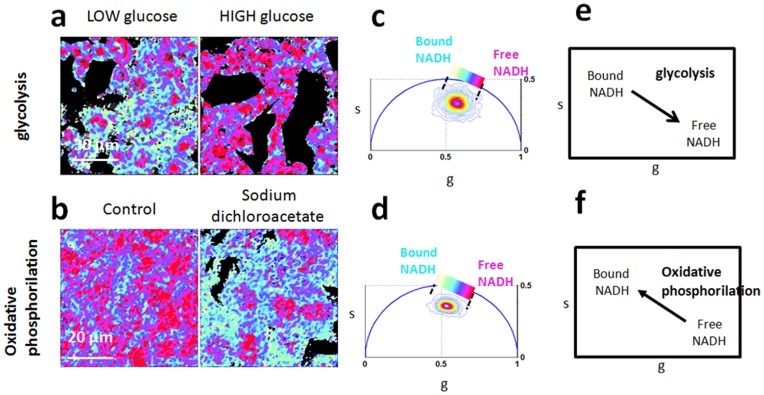
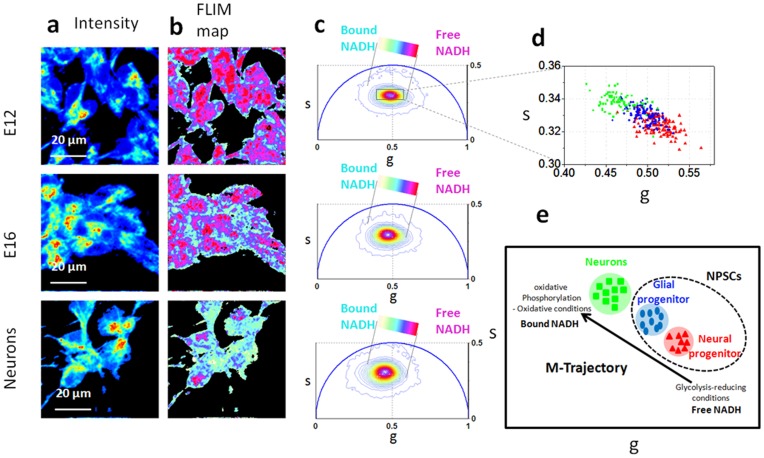
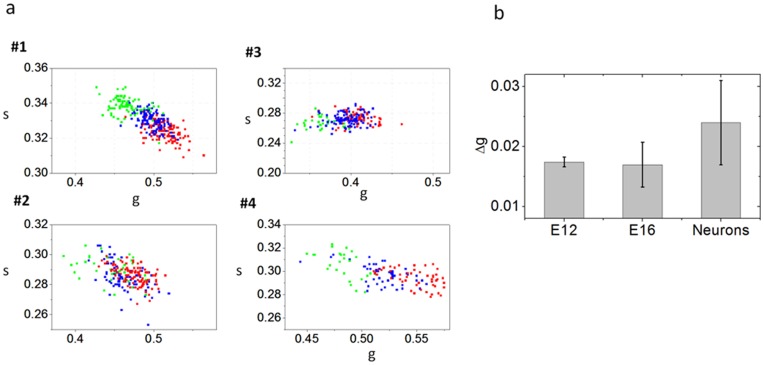
In the stem cell field there is a lack of non invasive and fast methods to identify stem cell's metabolic state, differentiation state and cell-lineage commitment. Here we describe a label-free method that uses NADH as an intrinsic biomarker and the Phasor approach to Fluorescence Lifetime microscopy to measure the metabolic fingerprint of cells. We show that different metabolic states are related to different cell differentiation stages and to stem cell bias to neuronal and glial fate, prior the expression of lineage markers. Our data demonstrate that the NADH FLIM signature distinguishes non-invasively neurons from undifferentiated neural progenitor and stem cells (NPSCs) at two different developmental stages (E12 and E16). NPSCs follow a metabolic trajectory from a glycolytic phenotype to an oxidative phosphorylation phenotype through different stages of differentiation. NSPCs are characterized by high free/bound NADH ratio, while differentiated neurons are characterized by low free/bound NADH ratio. We demonstrate that the metabolic signature of NPSCs correlates with their differentiation potential, showing that neuronal progenitors and glial progenitors have a different free/bound NADH ratio. Reducing conditions in NPSCs correlates with their neurogenic potential, while oxidative conditions correlate with glial potential. For the first time we show that FLIM NADH metabolic fingerprint provides a novel, and quantitative measure of stem cell potential and a label-free and non-invasive means to identify neuron- or glial- biased progenitors.
Conflict of interest statement
Figures

Similar articles
-
Metabolic trajectory of cellular differentiation in small intestine by Phasor Fluorescence Lifetime Microscopy of NADH.Sci Rep. 2012;2:568. doi: 10.1038/srep00568. Epub 2012 Aug 10. Sci Rep. 2012. PMID: 22891156 Free PMC article.
-
Spatial Characterization of Bioenergetics and Metabolism of Primordial to Preovulatory Follicles in Whole Ex Vivo Murine Ovary.Biol Reprod. 2016 Dec;95(6):129. doi: 10.1095/biolreprod.116.142141. Epub 2016 Sep 28. Biol Reprod. 2016. PMID: 27683265 Free PMC article.
-
Determination of the metabolic index using the fluorescence lifetime of free and bound nicotinamide adenine dinucleotide using the phasor approach.J Biophotonics. 2019 Nov;12(11):e201900156. doi: 10.1002/jbio.201900156. Epub 2019 Jul 29. J Biophotonics. 2019. PMID: 31194290 Free PMC article.
-
Analyzing Olfactory Neuron Precursors Non-Invasively Isolated through NADH FLIM as a Potential Tool to Study Oxidative Stress in Alzheimer's Disease.Int J Mol Sci. 2021 Jun 12;22(12):6311. doi: 10.3390/ijms22126311. Int J Mol Sci. 2021. PMID: 34204595 Free PMC article. Review.
-
The redox switch/redox coupling hypothesis.Neurochem Int. 2006 May-Jun;48(6-7):523-30. doi: 10.1016/j.neuint.2005.12.036. Epub 2006 Mar 10. Neurochem Int. 2006. PMID: 16530294 Review.
Cited by
-
The Combination of Whole Cell Lipidomics Analysis and Single Cell Confocal Imaging of Fluidity and Micropolarity Provides Insight into Stress-Induced Lipid Turnover in Subcellular Organelles of Pancreatic Beta Cells.Molecules. 2019 Oct 17;24(20):3742. doi: 10.3390/molecules24203742. Molecules. 2019. PMID: 31627330 Free PMC article. Review.
-
A metabolic interpretation for the response of cellular autofluorescence to chemical perturbations assessed using spectral phasor analysis.RSC Adv. 2018 Dec 12;8(72):41526-41535. doi: 10.1039/c8ra07691j. eCollection 2018 Dec 7. RSC Adv. 2018. PMID: 35559319 Free PMC article.
-
Automated Phasor Segmentation of Fluorescence Lifetime Imaging Data for Discriminating Pigments and Binders Used in Artworks.Molecules. 2022 Feb 22;27(5):1475. doi: 10.3390/molecules27051475. Molecules. 2022. PMID: 35268575 Free PMC article.
-
Targeting Breast Cancer Stem Cell State Equilibrium through Modulation of Redox Signaling.Cell Metab. 2018 Jul 3;28(1):69-86.e6. doi: 10.1016/j.cmet.2018.06.006. Cell Metab. 2018. PMID: 29972798 Free PMC article.
-
Visualization of drug distribution of a topical minocycline gel in human facial skin.Biomed Opt Express. 2018 Jun 27;9(7):3434-3448. doi: 10.1364/BOE.9.003434. eCollection 2018 Jul 1. Biomed Opt Express. 2018. PMID: 29984108 Free PMC article.
References
-
- Doetsch F, Petreanu L, Caille I, Garcia-Verdugo JM, Alvarez-Buylla A (2002) EGF converts transit-amplifying neurogenic precursors in the adult brain into multipotent stem cells. Neuron 36: 1021–1034. - PubMed
-
- Johnson KW, Dooner M, Quesenberry PJ (2007) Fluorescence activated cell sorting: a window on the stem cell. Curr Pharm Biotechnol 8: 133–139. - PubMed
-
- Rao RR, Johnson AV, Stice SL (2007) Cell surface markers in human embryonic stem cells Methods Mol Biol. 407: 51–61. - PubMed
Publication types
MeSH terms
Substances
Grants and funding
LinkOut - more resources
Full Text Sources
Other Literature Sources
