. 2012;7(11):e48262.
doi: 10.1371/journal.pone.0048262. Epub 2012 Nov 7.

Integrative analysis reveals relationships of genetic and epigenetic alterations in osteosarcoma

Affiliations

Integrative analysis reveals relationships of genetic and epigenetic alterations in osteosarcoma

Stine H Kresse et al. PLoS One. 2012.

Abstract

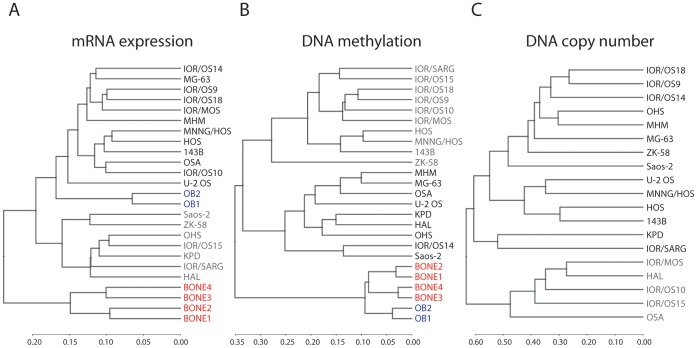
Background: Osteosarcomas are the most common non-haematological primary malignant tumours of bone, and all conventional osteosarcomas are high-grade tumours showing complex genomic aberrations. We have integrated genome-wide genetic and epigenetic profiles from the EuroBoNeT panel of 19 human osteosarcoma cell lines based on microarray technologies.

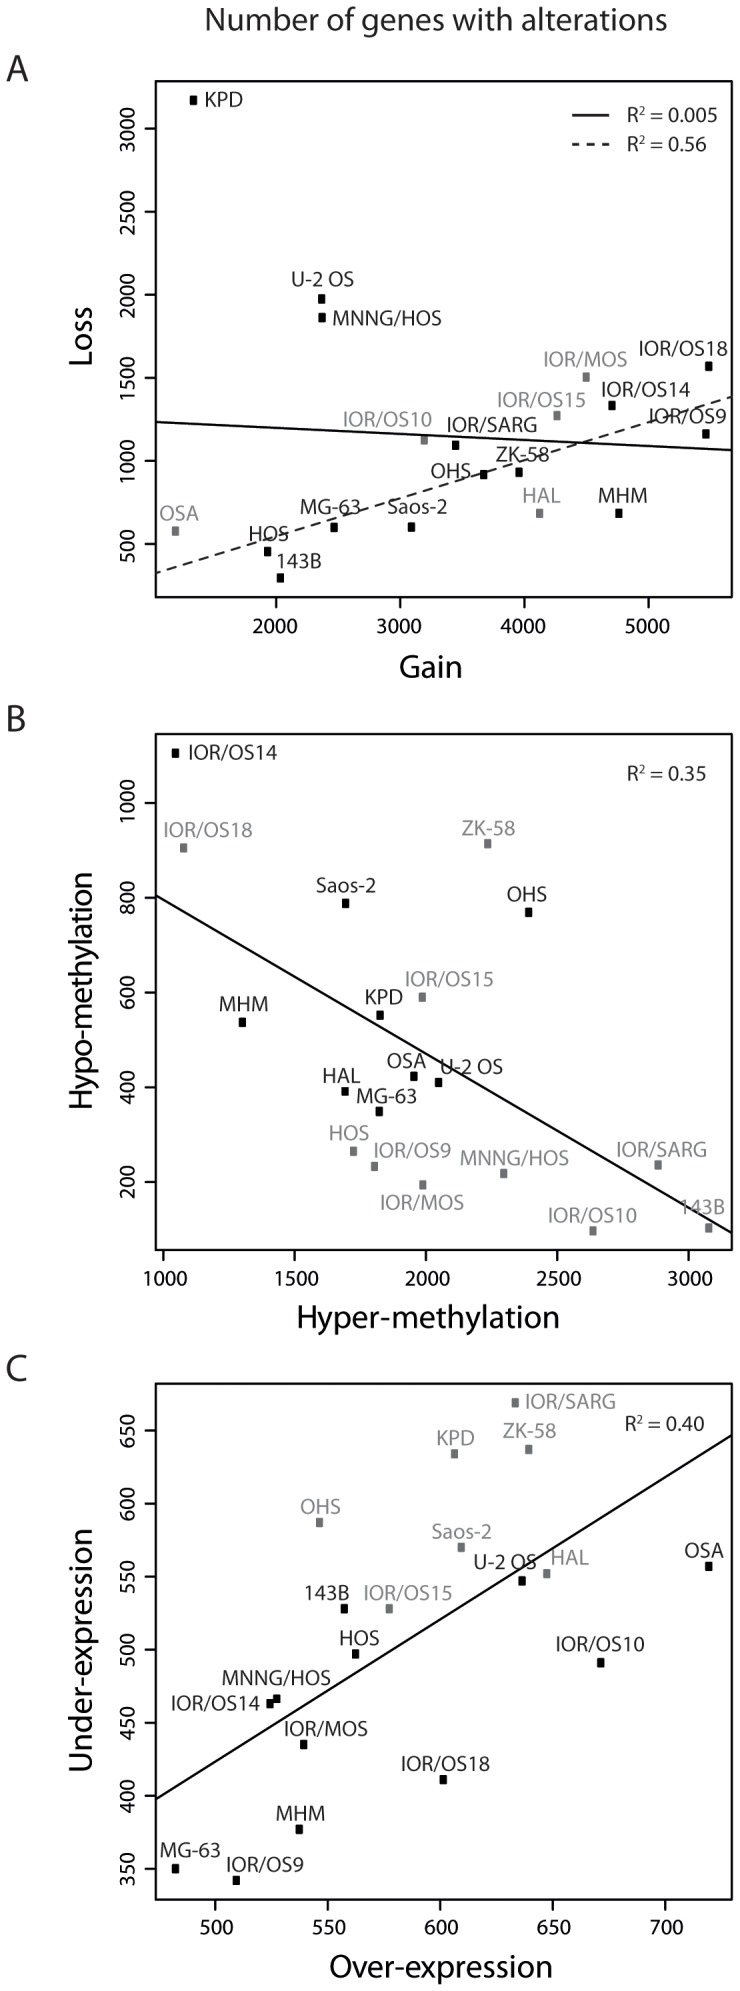
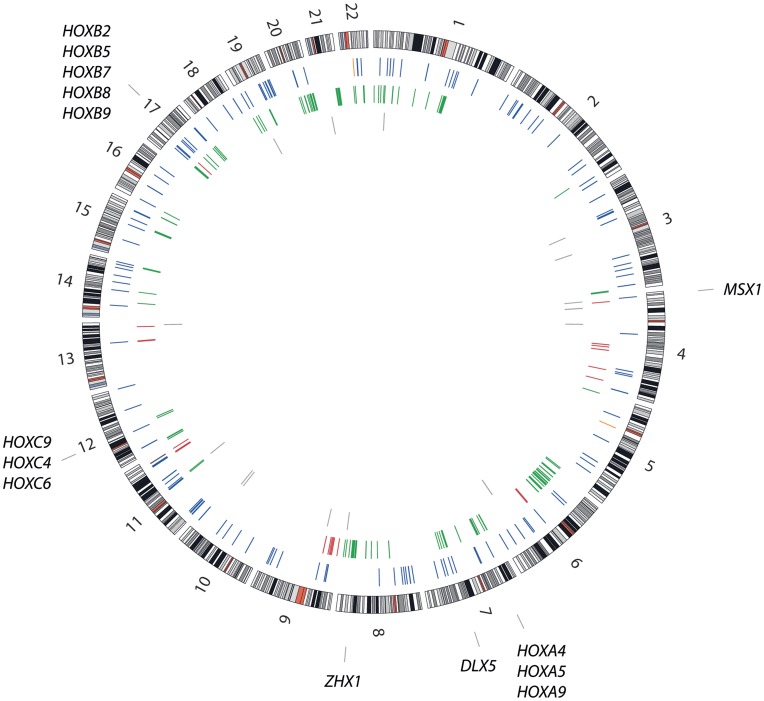
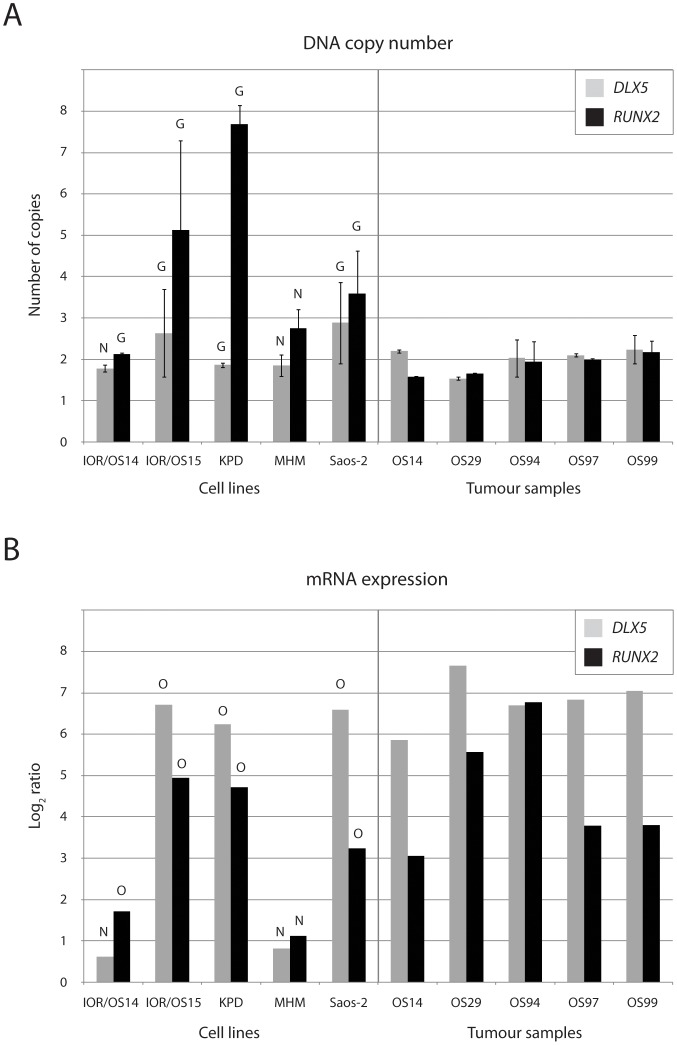
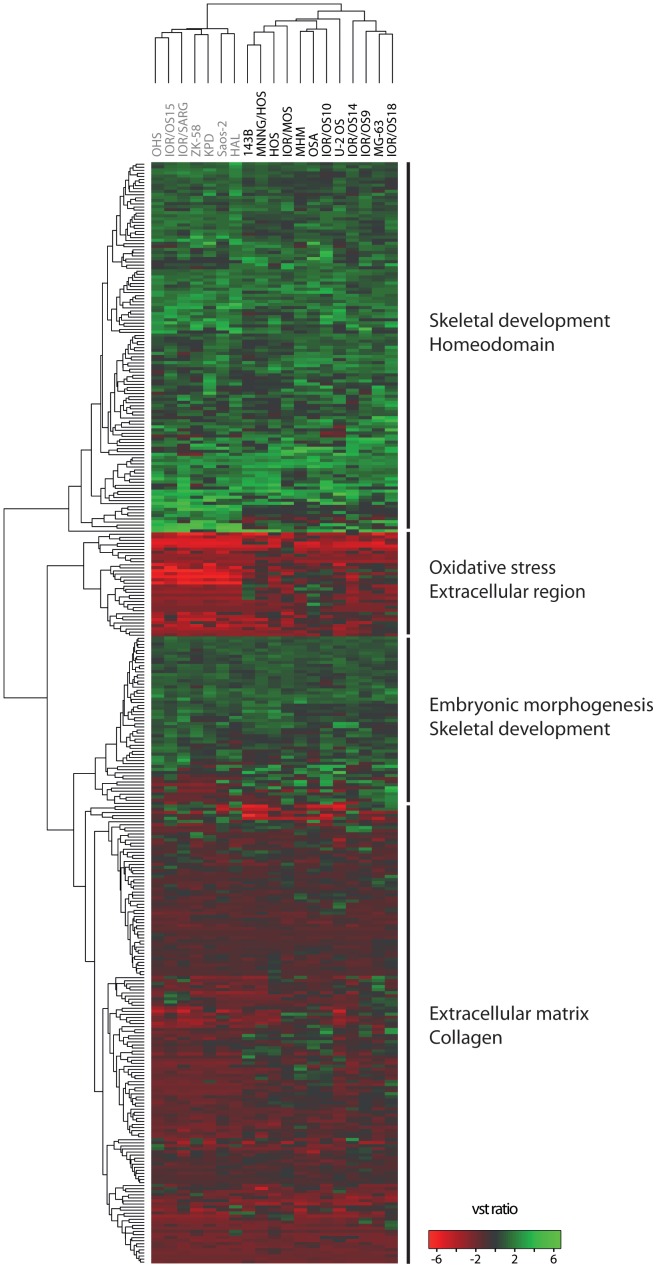
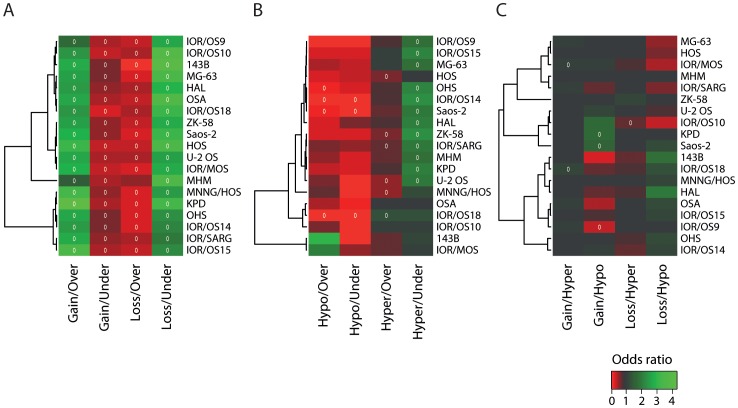
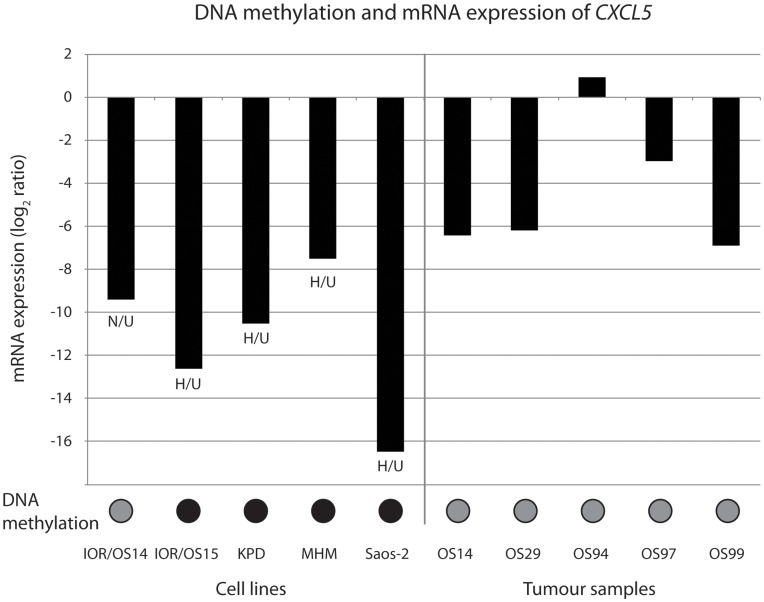
Principal findings: The cell lines showed complex patterns of DNA copy number changes, where genomic copy number gains were significantly associated with gene-rich regions and losses with gene-poor regions. By integrating the datasets, 350 genes were identified as having two types of aberrations (gain/over-expression, hypo-methylation/over-expression, loss/under-expression or hyper-methylation/under-expression) using a recurrence threshold of 6/19 (>30%) cell lines. The genes showed in general alterations in either DNA copy number or DNA methylation, both within individual samples and across the sample panel. These 350 genes are involved in embryonic skeletal system development and morphogenesis, as well as remodelling of extracellular matrix. The aberrations of three selected genes, CXCL5, DLX5 and RUNX2, were validated in five cell lines and five tumour samples using PCR techniques. Several genes were hyper-methylated and under-expressed compared to normal osteoblasts, and expression could be reactivated by demethylation using 5-Aza-2'-deoxycytidine treatment for four genes tested; AKAP12, CXCL5, EFEMP1 and IL11RA. Globally, there was as expected a significant positive association between gain and over-expression, loss and under-expression as well as hyper-methylation and under-expression, but gain was also associated with hyper-methylation and under-expression, suggesting that hyper-methylation may oppose the effects of increased copy number for detrimental genes.

Conclusions: Integrative analysis of genome-wide genetic and epigenetic alterations identified dependencies and relationships between DNA copy number, DNA methylation and mRNA expression in osteosarcomas, contributing to better understanding of osteosarcoma biology.


Conflict of interest statement

Competing Interests: The authors have declared that no competing interests exist.

Figures

Figure 1
Figure 1. Hierarchical clustering of osteosarcoma cell lines and normal samples.
Dendrograms from unsupervised hierarchical clustering of the osteosarcoma cell lines, normal bone and normal osteoblast samples based on genome-wide (A) mRNA expression (vst transformed and quantile normalised probe intensities), (B) DNA methylation (probe beta values) and (C) DNA copy number (probe intensities). The osteosarcoma cell lines have been colour-coded in gray and black, highlighting the two main subclusters, the normal bone samples in red and the normal osteoblast samples in blue. The clusters were made using Spearman correlation as distance measure and complete linkage.
Figure 2
Figure 2. Number of genes with alterations.
Plot of the number of genes with (A) gain and loss, (B) hyper- and hypo-methylation and (C) over- and under-expression for all the cell lines. The linear regression line is indicated in black. For the copy number (A), the linear regression line omitting the outlier samples U-2 OS, MNNG/HOS and KPD is indicated with a dashed line. The cell lines are colour-coded in gray and black according to the separation into two main subclusters from the respective unsupervised hierarchical clustering (Figure 1).
Figure 3
Figure 3. Number of genes with alterations for two-way combinations.
Plot of the number of genes with alterations for all 12 two-way combinations at different sample recurrence thresholds. The recurrence threshold of 6/19 cell lines (>30%) is indicated with a black line.
Figure 4
Figure 4. Genomic location of 350 genes that recurrently showed two types of aberrations.
Circos plot showing the genomic location of the 350 genes that recurrently showed two types of aberrations. The locations are colour-coded according to the type of aberrations; orange, hypo-methylation/over-expression; blue, hyper-methylation/under-expression; green, gain/over-expression; red, loss/under-expression; gray, (gain or hypo-methylation)/over-expression and (loss or hyper-methylation)/under-expression. The genomic location of the 14 homeobox genes in the list is indicated in the outermost circle.
Figure 5
Figure 5. DNA copy number and mRNA expression of DLX5 and RUNX2.
Plot of (A) DNA copy number levels of DLX5 and RUNX2 based on quantitative real-time PCR and (B) mRNA expression levels of DLX5 and RUNX2 based on quantitative real-time RT-PCR, in five cell lines and five tumour samples. The DNA copy number levels have been normalised to the average copy number of two control genes, EEF1G and FBXO11, whereas the mRNA expression levels have been normalised to the expression of the house-keeping gene GAPDH and then to the average expression level of the two normal osteoblast samples. The DNA copy number and mRNA expression levels based on the microarray data are indicated for the cell lines; N, normal copy number/expression; G, gain; O, over-expression.
Figure 6
Figure 6. Hierarchical clustering based on 350 genes that recurrently showed two types of aberrations.
Hierarchical clustering of the osteosarcoma cell lines based on the expression level of the 350 genes that recurrently showed two types of aberrations. The main terms from functional enrichment analysis using DAVID is indicated for each main subcluster of genes. The cell lines are colour-coded in gray and black according to the separation into two main subclusters from the unsupervised hierarchical clustering based on the global mRNA expression (Figure 1A). The cluster was made using Euclidian as distance measure and complete linkage. Green, increased gene expression; red, decreased gene expression.
Figure 7
Figure 7. Data dependencies for two-way combinations.
Heat map plots visualising the odds ratio and significance of data dependencies, with unsupervised hierarchical clustering of the cell lines, for two-way combinations of (A) DNA copy number and gene expression, (B) DNA methylation and mRNA expression and (C) DNA copy number and DNA methylation. The colours of the heat map plot represent the odds ratio for a gene of having one type of aberration given that it has another type of aberration. Green, positive association (odds ratio >1); black, no association (odds ratio = 1) and red, negative association (odds ratio <1). A white circle indicates significance (Benjamini & Hochberg-corrected chi-square p-value <0.05).
Figure 8
Figure 8. DNA methylation and mRNA expression of CXCL5.
Plot of the DNA methylation status and mRNA expression level of CXCL5 based on methylation-specific PCR and quantitative real-time RT-PCR, respectively, in five cell lines and five tumour samples. The mRNA expression levels have been normalised to the expression of the house-keeping gene GAPDH and then to the average expression level of the two normal osteoblast samples. The DNA methylation status is indicated with coloured circles; black, full methylation, grey, partial methylation. The DNA methylation and mRNA expression levels based on the microarray data are indicated for the cell lines; N, normal methylation; H, hyper-methylation; U, under-expression.
Figure 9
Figure 9. Gene expression after demethylation treatment.
Relative gene expression levels of the frequently hyper-methylated and under-expressed genes CXCL5, AKAP12, EFEMP1 and IL11RA after treatment with the demethylating agent 5-Aza-2′-deoxycytidine in 12 of the cell lines. The cell lines with hyper-methylation and under-expression of the genes are colour-coded in black, whereas gray colour indicates no aberrations in DNA methylation. The expression level without treatment has been set to 1 for each cell line.
Figure 10
Figure 10. Data dependencies for three-way combinations.
Heat map plots visualising the odds ratio and significance of data dependencies, with unsupervised hierarchical clustering of the cell lines, for combinations of hyper-methylation and mRNA expression, conditioning on the DNA copy number status. The colours of the heat map plot represent the odds ratio for a gene of having one type of aberration given that it has another type of aberration. Green, positive association (odds ratio >1); black, no association (odds ratio = 1) and red, negative association (odds ratio <1). A white circle indicates significance (Benjamini & Hochberg-corrected chi-square p-value <0.05). Exp, mRNA expression; CN, DNA copy number.

References

    1. Raymond AK, Ayala AG, Knuutila S (2002) Conventional osteosarcoma. In: Fletcher CDM, Unni KK, Mertens F, editors. World Health Organization Classification of Tumours Pathology and Genetics of Tumours of Soft Tissue and Bone. Lyon: IARC Press.
    1. Aksnes LH, Hall KS, Folleraas G, Stenwig AE, Bjerkehagen B, et al. (2006) Management of high-grade bone sarcomas over two decades: the Norwegian Radium Hospital experience. Acta Oncol 45: 38–46. - PubMed
    1. PosthumaDeBoer J, Witlox MA, Kaspers GJ, van Royen BJ (2011) Molecular alterations as target for therapy in metastatic osteosarcoma: a review of literature. Clin Exp Metastasis 28: 493–503. - PMC - PubMed
    1. Hattinger CM, Pasello M, Ferrari S, Picci P, Serra M (2010) Emerging drugs for high-grade osteosarcoma. Expert Opin Emerg Drugs 15: 615–634. - PubMed
    1. Lewis IJ, Nooij MA, Whelan J, Sydes MR, Grimer R, et al. (2007) Improvement in histologic response but not survival in osteosarcoma patients treated with intensified chemotherapy: a randomized phase III trial of the European Osteosarcoma Intergroup. J Natl Cancer Inst 99: 112–128. - PubMed

Publication types