Real-time monitoring of photocytotoxicity in nanoparticles-based photodynamic therapy: a model-based approach
- PMID: 23144911
- PMCID: PMC3492457
- DOI: 10.1371/journal.pone.0048617
Real-time monitoring of photocytotoxicity in nanoparticles-based photodynamic therapy: a model-based approach
Abstract
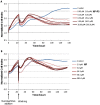
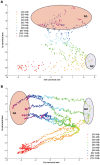
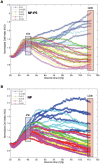
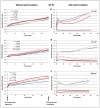
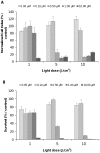
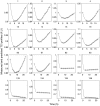
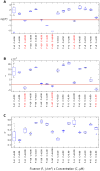
Nanoparticles are widely suggested as targeted drug-delivery systems. In photodynamic therapy (PDT), the use of multifunctional nanoparticles as photoactivatable drug carriers is a promising approach for improving treatment efficiency and selectivity. However, the conventional cytotoxicity assays are not well adapted to characterize nanoparticles cytotoxic effects and to discriminate early and late cell responses. In this work, we evaluated a real-time label-free cell analysis system as a tool to investigate in vitro cyto- and photocyto-toxicity of nanoparticles-based photosensitizers compared with classical metabolic assays. To do so, we introduced a dynamic approach based on real-time cell impedance monitoring and a mathematical model-based analysis to characterize the measured dynamic cell response. Analysis of real-time cell responses requires indeed new modeling approaches able to describe suited use of dynamic models. In a first step, a multivariate analysis of variance associated with a canonical analysis of the obtained normalized cell index (NCI) values allowed us to identify different relevant time periods following nanoparticles exposure. After light irradiation, we evidenced discriminant profiles of cell index (CI) kinetics in a concentration- and light dose-dependent manner. In a second step, we proposed a full factorial design of experiments associated with a mixed effect kinetic model of the CI time responses. The estimated model parameters led to a new characterization of the dynamic cell responses such as the magnitude and the time constant of the transient phase in response to the photo-induced dynamic effects. These parameters allowed us to characterize totally the in vitro photodynamic response according to nanoparticle-grafted photosensitizer concentration and light dose. They also let us estimate the strength of the synergic photodynamic effect. This dynamic approach based on statistical modeling furnishes new insights for in vitro characterization of nanoparticles-mediated effects on cell proliferation with or without light irradiation.
Conflict of interest statement
Figures




Similar articles
-
Folate-mediated and pH-responsive chidamide-bound micelles encapsulating photosensitizers for tumor-targeting photodynamic therapy.Int J Nanomedicine. 2019 Jul 22;14:5527-5540. doi: 10.2147/IJN.S208649. eCollection 2019. Int J Nanomedicine. 2019. PMID: 31413561 Free PMC article.
-
Synergistic chemo-photodynamic therapy mediated by light-activated ROS-degradable nanocarriers.J Mater Chem B. 2019 Jan 21;7(3):460-468. doi: 10.1039/c8tb03030h. Epub 2018 Dec 19. J Mater Chem B. 2019. PMID: 32254733
-
Photodynamic efficacy of photosensitizers under an attenuated light dose via lipid nano-carrier-mediated nuclear targeting.Biomaterials. 2012 Jul;33(21):5478-86. doi: 10.1016/j.biomaterials.2012.04.023. Epub 2012 May 3. Biomaterials. 2012. PMID: 22560197
-
Multifunctional nanoparticles as photosensitizer delivery carriers for enhanced photodynamic cancer therapy.Mater Sci Eng C Mater Biol Appl. 2020 Oct;115:111099. doi: 10.1016/j.msec.2020.111099. Epub 2020 May 16. Mater Sci Eng C Mater Biol Appl. 2020. PMID: 32600703 Review.
-
Nanoparticles improve biological functions of phthalocyanine photosensitizers used for photodynamic therapy.Curr Drug Metab. 2012 Oct;13(8):1119-22. doi: 10.2174/138920012802850074. Curr Drug Metab. 2012. PMID: 22380016 Review.
Cited by
-
Preparation of a highly crosslinked biosafe dental nanocomposite resin with a tetrafunctional methacrylate quaternary ammonium salt monomer.RSC Adv. 2019 Dec 16;9(71):41616-41627. doi: 10.1039/c9ra09173d. eCollection 2019 Dec 13. RSC Adv. 2019. PMID: 35541606 Free PMC article.
-
iCELLigence real-time cell analysis system for examining the cytotoxicity of drugs to cancer cell lines.Exp Ther Med. 2017 Sep;14(3):1866-1870. doi: 10.3892/etm.2017.4781. Epub 2017 Jul 11. Exp Ther Med. 2017. PMID: 28962095 Free PMC article.
-
Novel ZnO:Ag nanocomposites induce significant oxidative stress in human fibroblast malignant melanoma (Ht144) cells.Beilstein J Nanotechnol. 2015 Feb 26;6:570-82. doi: 10.3762/bjnano.6.59. eCollection 2015. Beilstein J Nanotechnol. 2015. PMID: 25821698 Free PMC article.
-
Suitability of cell-based label-free detection for cytotoxicity screening of carbon nanotubes.Biomed Res Int. 2013;2013:564804. doi: 10.1155/2013/564804. Epub 2013 Nov 27. Biomed Res Int. 2013. PMID: 24377092 Free PMC article.
-
Antibacterial and thermomechanical properties of experimental dental resins containing quaternary ammonium monomers with two or four methacrylate groups.RSC Adv. 2019 Dec 9;9(69):40681-40688. doi: 10.1039/c9ra07788j. eCollection 2019 Dec 3. RSC Adv. 2019. PMID: 35542684 Free PMC article.
References
-
- Praetorius NP, Mandal TK (2007) Engineered nanoparticles in cancer therapy. Recent Pat Drug Deliv Formul 1: 37–51. - PubMed
-
- Koo H, Huh MS, Sun IC, Yuk SH, Choi K, et al. (2011) In vivo targeted delivery of nanoparticles for theranosis. Acc Chem Res 44: 1018–1028. - PubMed
-
- Hong S, Leroueil PR, Janus EK, Peters JL, Kober MM, et al. (2006) Interaction of polycationic polymers with supported lipid bilayers and cells: nanoscale hole formation and enhanced membrane permeability. Bioconjug Chem 17: 728–734. - PubMed
-
- Caruso G, Caffo M, Alafaci C, Raudino G, Cafarella D, et al. (2011) Could nanoparticle systems have a role in the treatment of cerebral gliomas? Nanomedicine 7: 744–752. - PubMed
Publication types
MeSH terms
Substances
LinkOut - more resources
Full Text Sources

