

Inter-hemispheric oscillations in human sleep
- PMID: 23144920
- PMCID: PMC3492490
- DOI: 10.1371/journal.pone.0048660
Inter-hemispheric oscillations in human sleep
Abstract
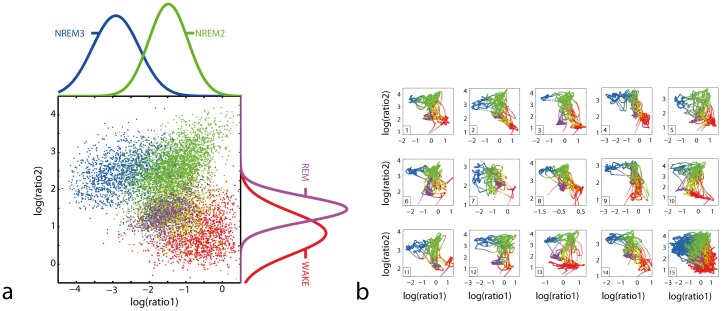
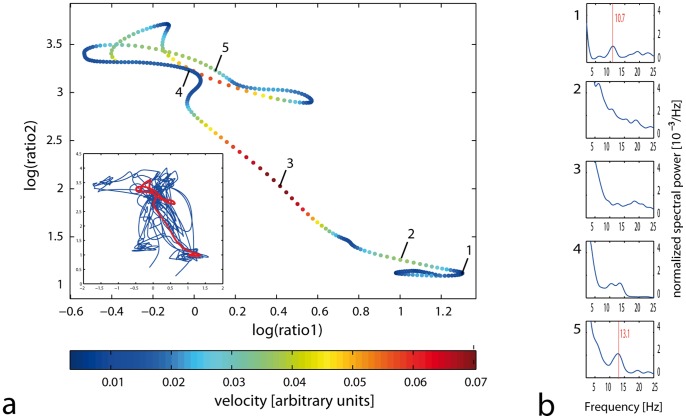
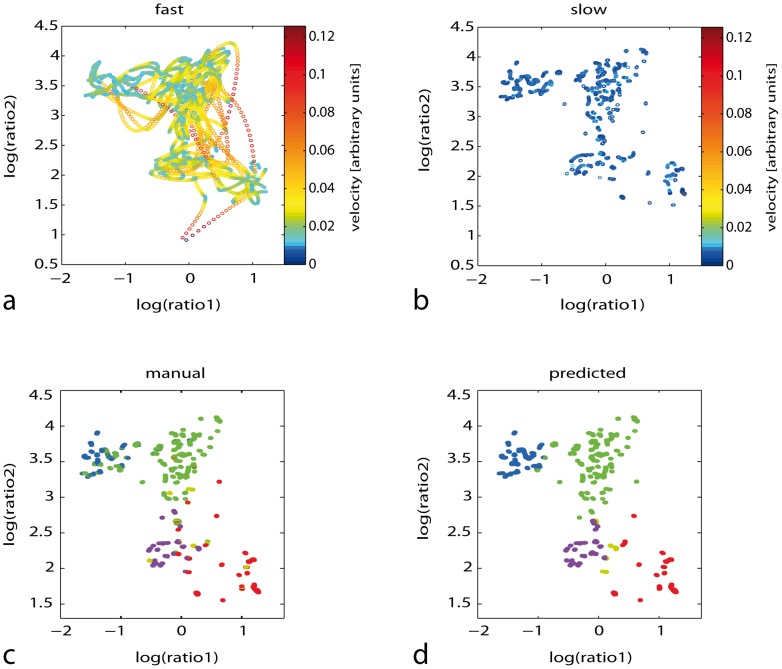
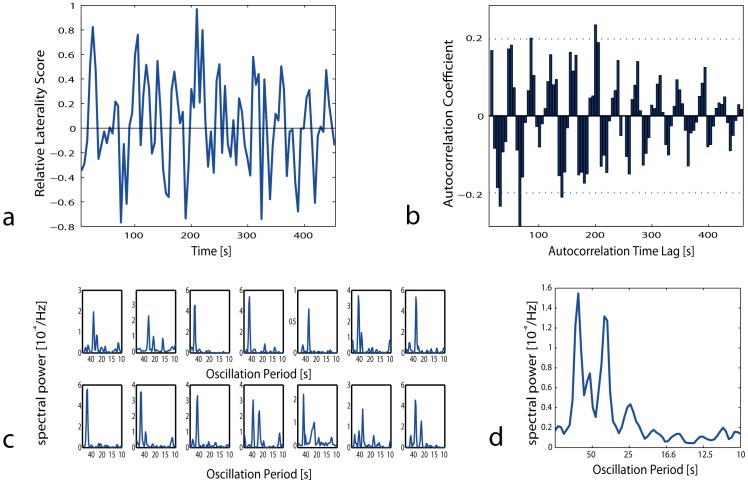
Sleep is generally categorized into discrete stages based on characteristic electroencephalogram (EEG) patterns. This traditional approach represents sleep architecture in a static way, but it cannot reflect variations in sleep across time and across the cortex. To investigate these dynamic aspects of sleep, we analyzed sleep recordings in 14 healthy volunteers with a novel, frequency-based EEG analysis. This approach enabled comparison of sleep patterns with low inter-individual variability. We then implemented a new probability dependent, automatic classification of sleep states that agreed closely with conventional manual scoring during consolidated sleep. Furthermore, this analysis revealed a previously unrecognized, interhemispheric oscillation during rapid eye movement (REM) sleep. This quantitative approach provides a new way of examining the dynamic aspects of sleep, shedding new light on the physiology of human sleep.
Conflict of interest statement
Figures
Similar articles
-
Human Rapid Eye Movement Sleep Shows Local Increases in Low-Frequency Oscillations and Global Decreases in High-Frequency Oscillations Compared to Resting Wakefulness.eNeuro. 2018 Aug 29;5(4):ENEURO.0293-18.2018. doi: 10.1523/ENEURO.0293-18.2018. eCollection 2018 Jul-Aug. eNeuro. 2018. PMID: 30225358 Free PMC article.
-
Interhemispheric sleep EEG asymmetry in the rat is enhanced by sleep deprivation.J Neurophysiol. 2002 Nov;88(5):2280-6. doi: 10.1152/jn.00304.2002. J Neurophysiol. 2002. PMID: 12424269
-
EEG Frontal Alpha Asymmetry and Dream Affect: Alpha Oscillations over the Right Frontal Cortex during REM Sleep and Presleep Wakefulness Predict Anger in REM Sleep Dreams.J Neurosci. 2019 Jun 12;39(24):4775-4784. doi: 10.1523/JNEUROSCI.2884-18.2019. Epub 2019 Apr 15. J Neurosci. 2019. PMID: 30988168 Free PMC article.
-
The Visual Scoring of Sleep in Infants 0 to 2 Months of Age.J Clin Sleep Med. 2016 Mar;12(3):429-45. doi: 10.5664/jcsm.5600. J Clin Sleep Med. 2016. PMID: 26951412 Free PMC article. Review.
-
Dreaming, handedness, and sleep architecture: interhemispheric mechanisms.Int Rev Neurobiol. 2010;92:215-32. doi: 10.1016/S0074-7742(10)92011-4. Int Rev Neurobiol. 2010. PMID: 20870070 Review.
Cited by
-
Temporal Variability Analysis of Cortical Blood Flow in Rats with Hyperacute Cerebral Ischemia.Neurosci Bull. 2025 Jul 25. doi: 10.1007/s12264-025-01450-z. Online ahead of print. Neurosci Bull. 2025. PMID: 40711751
-
Sleep/wake movement velocities, trajectories and micro-arousals during maturation in rats.BMC Neurosci. 2017 Feb 7;18(1):24. doi: 10.1186/s12868-017-0343-6. BMC Neurosci. 2017. PMID: 28173758 Free PMC article.
-
Sleep/Wake Dynamics Changes during Maturation in Rats.PLoS One. 2015 Apr 20;10(4):e0125509. doi: 10.1371/journal.pone.0125509. eCollection 2015. PLoS One. 2015. PMID: 25894573 Free PMC article.
-
Interhemispheric competition during sleep.Nature. 2023 Apr;616(7956):312-318. doi: 10.1038/s41586-023-05827-w. Epub 2023 Mar 22. Nature. 2023. PMID: 36949193 Free PMC article.
-
Can Gait Signatures Provide Quantitative Measures for Aiding Clinical Decision-Making? A Systematic Meta-Analysis of Gait Variability Behavior in Patients with Parkinson's Disease.Front Hum Neurosci. 2016 Jun 30;10:319. doi: 10.3389/fnhum.2016.00319. eCollection 2016. Front Hum Neurosci. 2016. PMID: 27445759 Free PMC article. Review.
References
-
- Huber R, Ghilardi MF, Massimini M, Tononi G (2004) Local sleep and learning. Nature 430: 78–81. - PubMed
-
- Krueger JM, Obal F (1993) A neuronal group theory of sleep function. J Sleep Res 2: 63–69. - PubMed
-
- Wehrle R, Kaufmann C, Wetter TC, Holsboer F, Auer DP, et al. (2007) Functional microstates within human REM sleep: first evidence from fMRI of a thalamocortical network specific for phasic REM periods. European Journal of Neuroscience 25: 863–871. - PubMed
MeSH terms
LinkOut - more resources
Full Text Sources
