

The determinants of HIV treatment costs in resource limited settings
- PMID: 23144946
- PMCID: PMC3492412
- DOI: 10.1371/journal.pone.0048726
The determinants of HIV treatment costs in resource limited settings
Erratum in
- PLoS One. 2013;8(5). doi:10.1371/annotation/1b6115d9-272e-4623-8ef7-265cd8e5aa28
Abstract
Background: Governments and international donors have partnered to provide free HIV treatment to over 6 million individuals in low and middle-income countries. Understanding the determinants of HIV treatment costs will help improve efficiency and provide greater certainty about future resource needs.
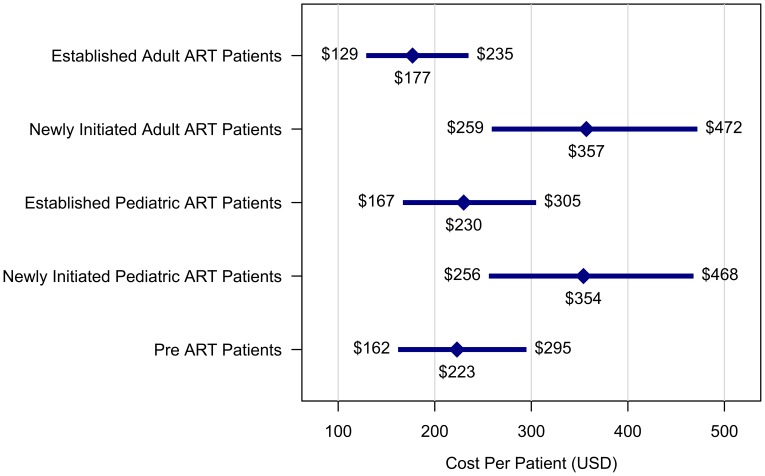
Methods and findings: We collected data on HIV treatment costs from 54 clinical sites in Botswana, Ethiopia, Mozambique, Nigeria, Uganda, and Vietnam. Sites provided free HIV treatment funded by the U.S. President's Emergency Plan for AIDS Relief (PEPFAR), national governments, and other partners. Service delivery costs were categorized into successive six-month periods from the date when each site began HIV treatment scale-up. A generalized linear mixed model was used to investigate relationships between site characteristics and per-patient costs, excluding ARV expenses. With predictors at their mean values, average annual per-patient costs were $177 (95% CI: 127-235) for pre-ART patients, $353 (255-468) for adult patients in the first 6 months of ART, and $222 (161-296) for adult patients on ART for >6 months (excludes ARV costs). Patient volume (no. patients receiving treatment) and site maturity (months since clinic began providing treatment services) were both strong independent predictors of per-patient costs. Controlling for other factors, costs declined by 43% (18-63) as patient volume increased from 500 to 5,000 patients, and by 28% (6-47) from 5,000 to 10,000 patients. For site maturity, costs dropped 41% (28-52) between months 0-12 and 25% (15-35) between months 12-24. Price levels (proxied by per-capita GDP) were also influential, with costs increasing by 22% (4-41) for each doubling in per-capita GDP. Additionally, the frequency of clinical follow-up, frequency of laboratory monitoring, and clinician-patient ratio were significant independent predictors of per-patient costs.
Conclusions: Substantial reductions in per-patient service delivery costs occur as sites mature and patient cohorts increase in size. Other predictors suggest possible strategies to reduce per-patient costs.
Conflict of interest statement
Figures


References
-
- UNAIDS (2010) UNAIDS Report on the Global AIDS Epidemic 2010. Geneva: UNAIDS.
-
- WHO (2010) Antiretroviral therapy for HIV infection in adults and adolescents: recommendations for a public health approach –2010 Revision. Geneva: WHO. - PubMed
-
- Holmes CB, Atun R, Avila C, Blandford JM (2011) Expanding the generation and use of economic and financial data to improve HIV program planning and efficiency: a global perspective. J Acquir Immune Defic Syndr 57 Suppl 2S104–108. - PubMed
-
- Walker DG, Over M, Bertozzi SM (2011) Can cost studies improve the performance of donor-financed HIV treatment? AIDS 25: 1795–1796. - PubMed
Publication types
MeSH terms
Substances
Grants and funding
LinkOut - more resources
Full Text Sources
Medical
