

Diffusion tensor metrics as biomarkers in Alzheimer's disease
- PMID: 23145075
- PMCID: PMC3492261
- DOI: 10.1371/journal.pone.0049072
Diffusion tensor metrics as biomarkers in Alzheimer's disease
Abstract
Background: Although diffusion tensor imaging has been a major research focus for Alzheimer's disease in recent years, it remains unclear whether it has sufficient stability to have biomarker potential. To date, frequently inconsistent results have been reported, though lack of standardisation in acquisition and analysis make such discrepancies difficult to interpret. There is also, at present, little knowledge of how the biometric properties of diffusion tensor imaging might evolve in the course of Alzheimer's disease.
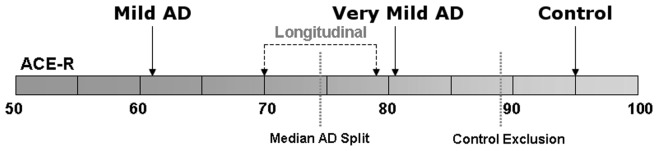
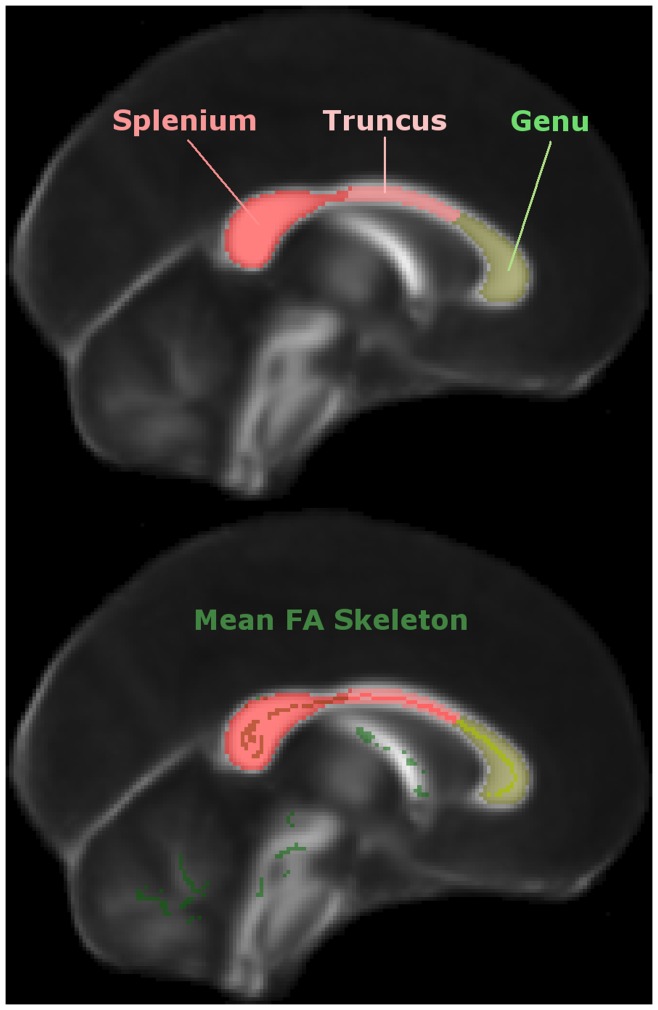
Methods: The biomarker question was addressed in this study by adopting a standardised protocol both for the whole brain (tract-based spatial statistics), and for a region of interest: the midline corpus callosum. In order to study the evolution of tensor changes, cross-sectional data from very mild (N = 21) and mild (N = 22) Alzheimer's disease patients were examined as well as a longitudinal cohort (N = 16) that had been rescanned at 12 months.
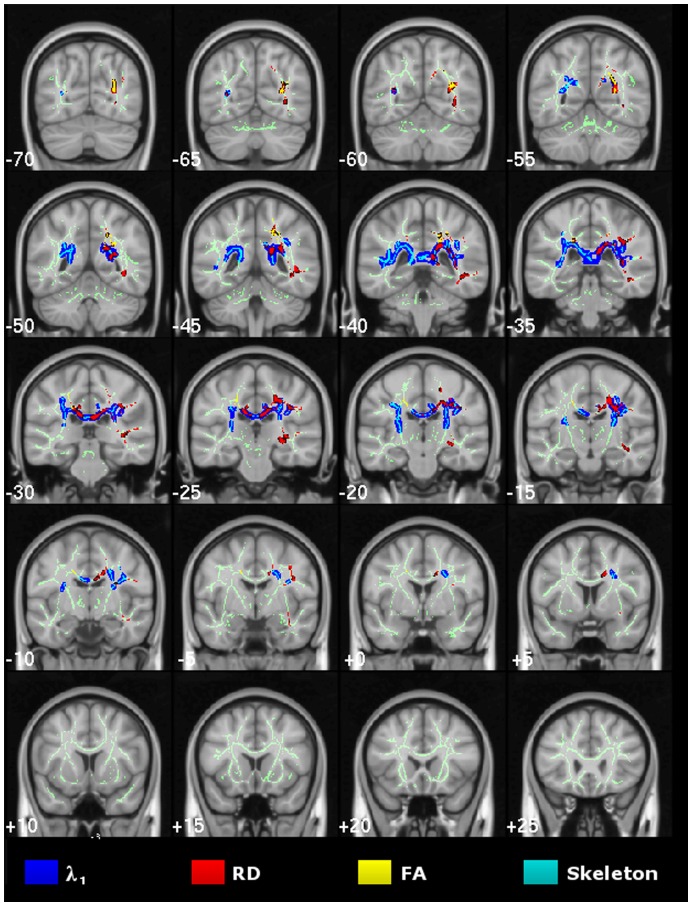
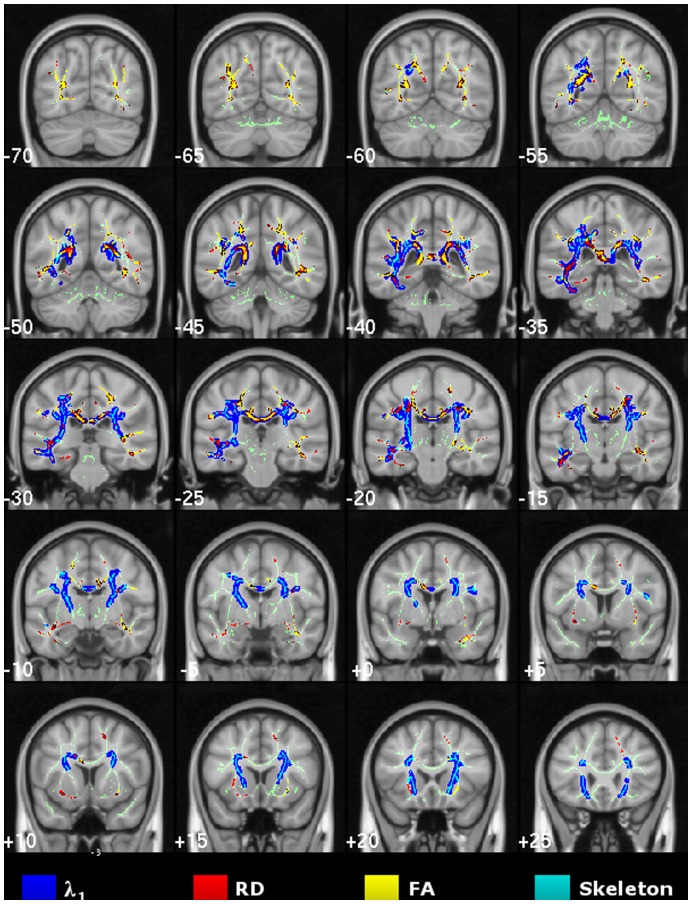
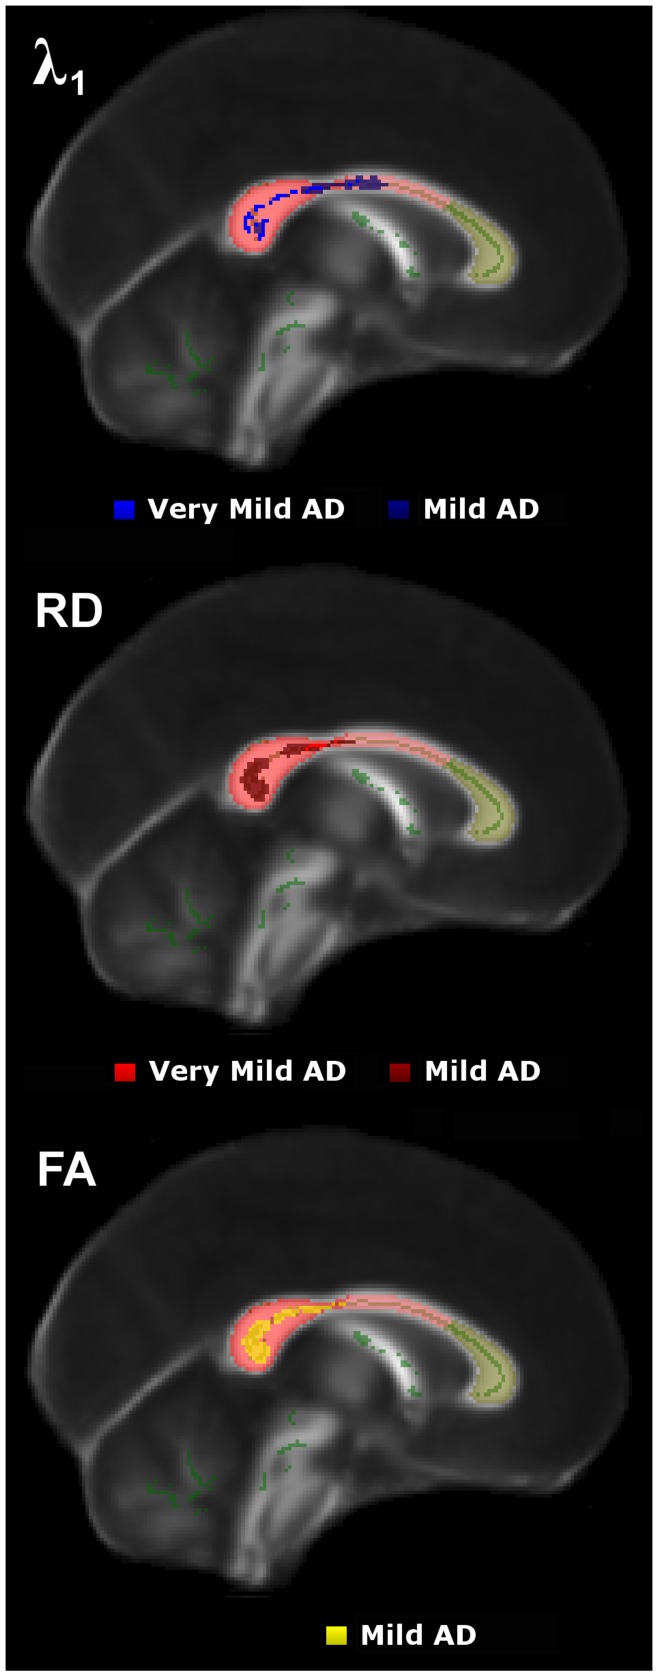
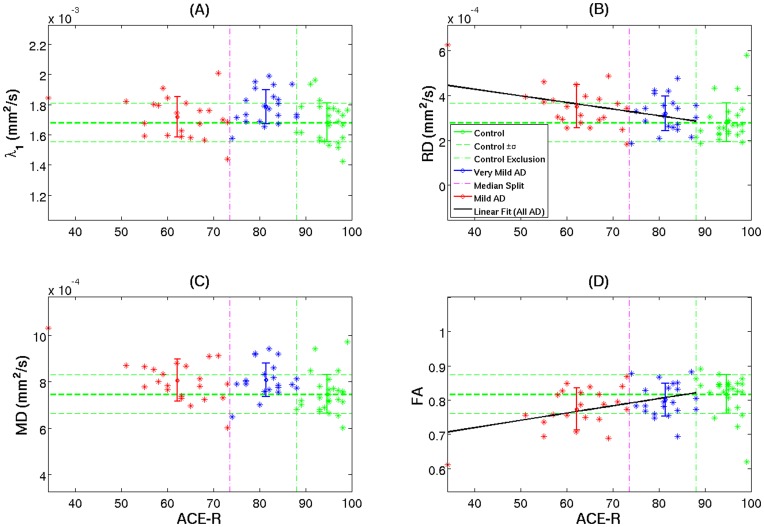
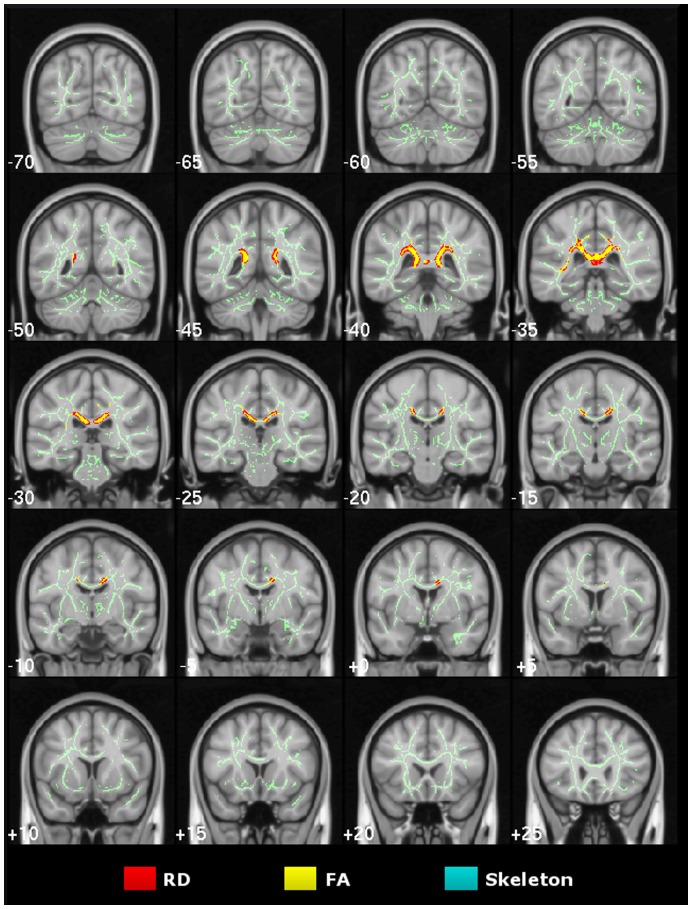
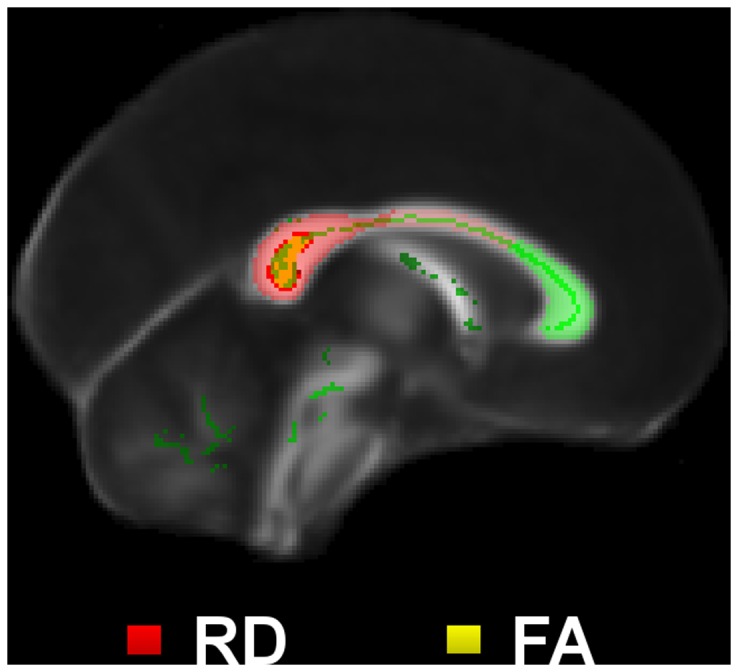
Findings and significance: The results revealed that increased axial and mean diffusivity are the first abnormalities to occur and that the first region to develop such significant differences was mesial parietal/splenial white matter; these metrics, however, remained relatively static with advancing disease indicating they are suitable as 'state-specific' markers. In contrast, increased radial diffusivity, and therefore decreased fractional anisotropy-though less detectable early-became increasingly abnormal with disease progression, and, in the splenium of the corpus callosum, correlated significantly with dementia severity; these metrics therefore appear 'stage-specific' and would be ideal for monitoring disease progression. In addition, the cross-sectional and longitudinal analyses showed that the progressive abnormalities in radial diffusivity and fractional anisotropy always occurred in areas that had first shown an increase in axial and mean diffusivity. Given that the former two metrics correlate with dementia severity, but the latter two did not, it would appear that increased axial diffusivity represents an upstream event that precedes neuronal loss.
Conflict of interest statement
Figures
References
-
- Fellgiebel A, Schermuly I, Gerhard A, Keller I, Albrecht J, et al. (2008) Functional relevant loss of long association fibre tracts integrity in early Alzheimer’s disease. Neuropsychologia 46: 1698–1706. - PubMed
-
- Takahashi S, Yonezawa H, Takahashi J, Kudo M, Inoue T, et al. (2002) Selective reduction of diffusion anisotropy in white matter of Alzheimer disease brains measured by 3.0 Tesla magnetic resonance imaging. Neurosci Lett 332: 45–48. - PubMed
-
- Acosta-Cabronero J, Williams GB, Pengas G, Nestor PJ (2010) Absolute diffusivities define the landscape of white matter degeneration in Alzheimer’s disease. Brain 133: 529–539. - PubMed
Publication types
MeSH terms
Substances
Grants and funding
LinkOut - more resources
Full Text Sources
Other Literature Sources
Medical
