. 2012;7(11):e49261.
doi: 10.1371/journal.pone.0049261. Epub 2012 Nov 8.

Natural variation in seed very long chain fatty acid content is controlled by a new isoform of KCS18 in Arabidopsis thaliana

Affiliations

Natural variation in seed very long chain fatty acid content is controlled by a new isoform of KCS18 in Arabidopsis thaliana

Sophie Jasinski et al. PLoS One. 2012.

Abstract

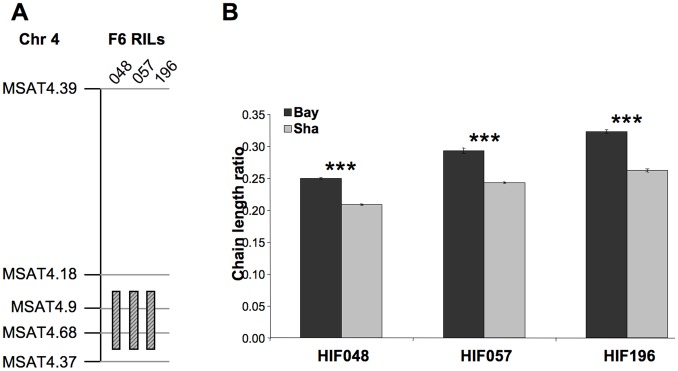
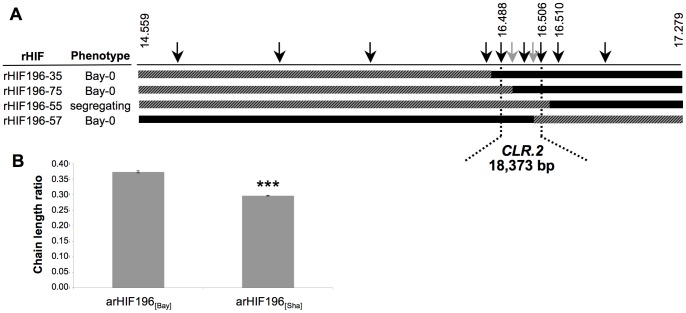
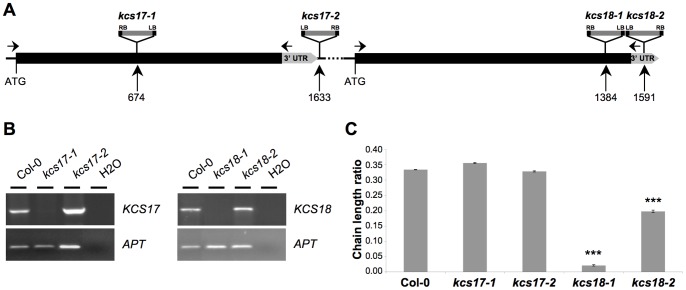
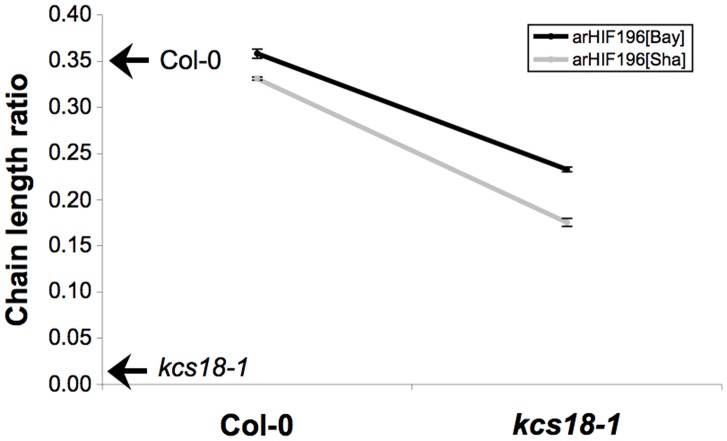
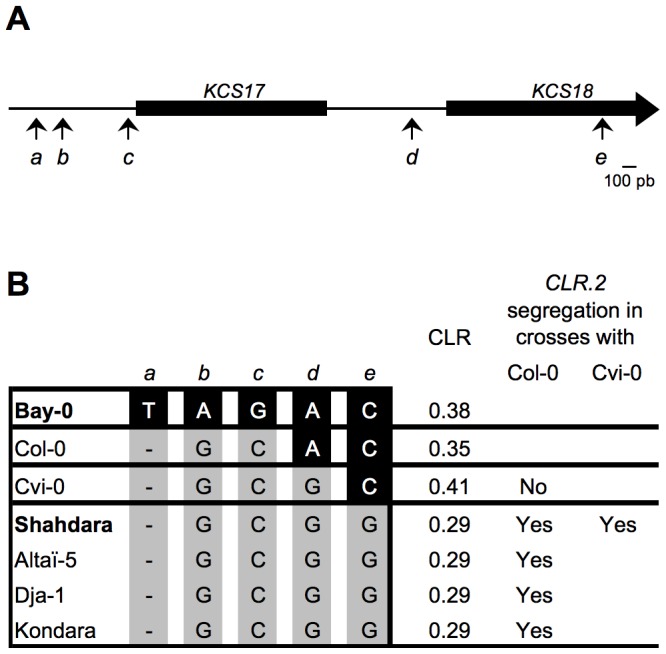
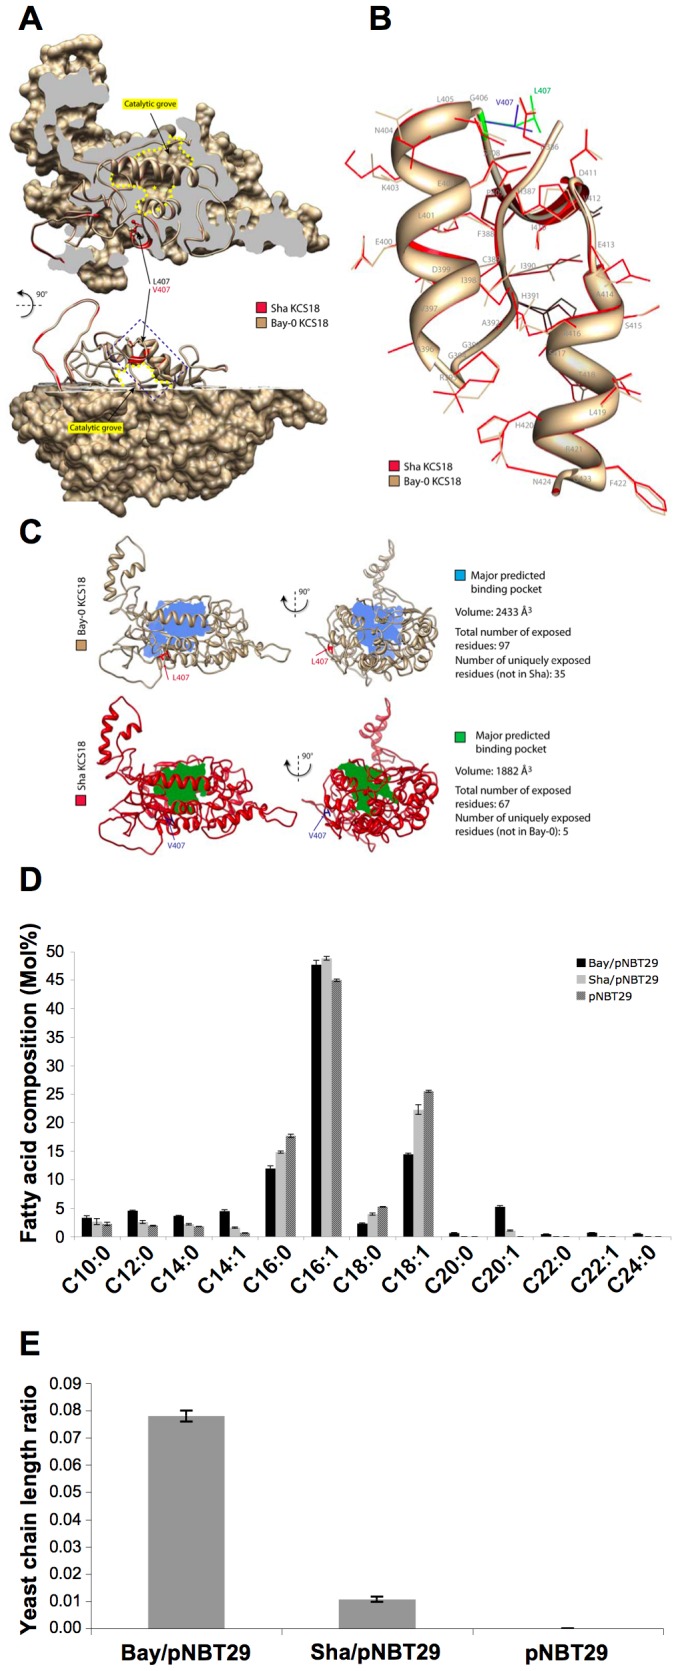
Oil from oleaginous seeds is mainly composed of triacylglycerols. Very long chain fatty acids (VLCFAs) are major constituents of triacylglycerols in many seed oils and represent valuable feedstock for industrial purposes. To identify genetic factors governing natural variability in VLCFA biosynthesis, a quantitative trait loci (QTL) analysis using a recombinant inbred line population derived from a cross between accessions Bay-0 and Shahdara was performed in Arabidopsis thaliana. Two fatty acid chain length ratio (CLR) QTL were identified, with one major locus, CLR.2, accounting for 77% of the observed phenotypic variation. A fine mapping and candidate gene approach showed that a key enzyme of the fatty acid elongation pathway, the β-ketoacyl-CoA synthase 18 (KCS18), was responsible for the CLR.2 QTL detected between Bay-0 and Shahdara. Association genetics and heterologous expression in yeast cells identified a single point mutation associated with an alteration of KCS18 activity, uncovering the molecular bases for the modulation of VLCFA content in these two natural populations of Arabidopsis. Identification of this kcs18 mutant with altered activity opens new perspectives for the modulation of oil composition in crop plants.


Conflict of interest statement

Competing Interests: The authors have declared that no competing interests exist.

Figures

Figure 1
Figure 1. Confirmation of the CLR.2 QTL with heterogeneous inbred families (HIFs).
A, F6 recombinant inbred lines (RILs) from the Bay-0 x Shahdara cross showing residual heterozygosity in the region of the CLR.2 QTL. Numbers on the top designate the RIL, with the hatched black and grey bar beneath indicating the region still segregating. Recombination breakpoints delimiting heterozygous regions are arbitrarily depicted in the middle of the marker interval. The vertical black line represents chromosome 4 with markers indicated on the left. Marker positions and identity can be found at www.inra.fr/vast/in the MSAT database. B, Comparison of CLR for HIFs fixed for the Bay (black) or the Sha (grey) allele at the segregating region. CLR was determined from 20 seeds per plants. Bars represent SE values (n = 8, 4 repetitions were done on 2 plants). Significance in t-test, ***p<10−8.
Figure 2
Figure 2. Fine mapping of CLR.2.
A, The genotype of the most informative recombinants (rHIFs) used to delineate the final 18,373-bp candidate interval are represented with horizontal bars (black for Bay allele, grey for Sha allele, hatched black/grey for heterozygous). Vertical black arrows above represent markers used for genotyping between 14.559 Mb and 17.279 Mb on chromosome 4. Numbers indicate physical position in Mb (TAIR8). Grey arrows mark the most informative recombination breakpoints. B, Chain length ratio of arHIF196[Bay] and arHIF196[Sha] (Materials and Methods) was compared. CLR was determined on 100 seeds from 4 independent plants for each arHIF. Bars represent SE values (n = 4). Significance in t-test, ***p<10−6.
Figure 3
Figure 3. kcs18 insertion mutants show CLR reduction.
A, Structure of the KCS17 and KCS18 genes with positions of the T-DNA insertions in kcs17-1, kcs17-2, kcs18-1 and kcs18-2 mutants indicated. Black boxes represent exons (KCS17 and KCS18 are intronless) and grey boxes represent 3′ UTR regions. Numbers indicate distance in basepairs from the ATG. LB, left border of T-DNA; RB, right border of T-DNA. B, RT-PCR analysis of KCS17 and KCS18 expression in 10-day-old seeds of wild type (Col-0), kcs17-1, kcs17-2, kcs18-1 and kcs18-2 plants. APT (ADENINE PHOSPHORIBOSYLTRANSFERASE) was used as a constitutively expressed gene control. Primers used for RT-PCR are indicated by arrows in A. For each genotype, 15 siliques (5 siliques harvested from 3 different plants) have been dissected. C, CLR from wild type (Col-0) and the indicated kcs mutants. kcs18 mutants display a lower CLR compared to Col-0 whereas kcs17 mutants display a similar CLR to Col-0. CLR was measured in triplicate on 100 seeds from a pool of 4 independent plants for each genotype. Bars represent SE values (n = 3). Significance in t-test, ***p<10−5.
Figure 4
Figure 4. Bay and Sha alleles at CLR.2 diversely complement kcs18-1 mutant.
CLR was determined for each of the four allelic combinations obtained in F1 seeds, generated by crossing arHIF196[Bay] or arHIF196[Sha] with a kcs18-1 mutant or its wild type background (Col-0). For each combination, 10 independent crosses have been done and CLR was determined from 100 seeds of each cross. Each data point represents the mean +/− SE (n = 10). CLR values for Col-0 and kcs18-1 are indicated by an arrow along the y axis. The QTL genotype x gene allele interaction term is very highly significant (p<0.1%).
Figure 5
Figure 5. One SNP in KCS18 coding sequence is sufficient to modulate chain length ratio.
A, Promoters and coding sequences of the KCS17 and KCS18 genes. SNPs identified between Bay-0 and Shahdara are indicated with letters and their respective positions are indicated by arrows. B, Regions covering SNPs shown in A have been sequenced in the indicated accessions. The nucleotide for each SNP is shown for all accessions. CLR values are indicated at the right in addition to CLR.2 segregation in crosses with Col-0 or Cvi-0.
Figure 6
Figure 6. A single amino acid change modulates KCS18 activity.
A, General view of Bay and Sha KCS18 protein models superimposition. Sha KCS18 is shown in red as a ribbon model, Bay KCS18 is shown in tan as a ribbon and surface model. Bay KCS18 model surface is clipped to reveal the position of the predicted catalytic grove, circled in yellow, and the position of the region harboring conformational changes. In both models, the side chain of the variable residue (407) is shown. The dotted blue box delimits the region highlighted in B. B, A close view of the region harboring conformational changes between Sha (red) and Bay (tan) KCS18 models. The models are depicted as ribbons with residue side chain backbones shown. Residue 407 is shown in blue (Sha model) and green (Bay model). C, Analysis of predicted binding pockets in Sha and Bay KCS18 models. Models are shown as ribbons in tan (Bay) and red (Sha), with residue 407 highlighted. The major binding pocket predicted by PocketFinder is shown as a filled volume in blue (Bay) and green (Sha). D, Fatty acid composition of yeast cells transformed with an empty vector (pNBT29), or a vector harboring the Bay (Bay/pNBT29) or Sha (Sha/pNBT29) KCS18 coding sequence. Values are a mean of 6 samples (3 replicates, 2 independent transformations). Bars represent SE. E, Yeast chain length ratio (the sum of all 20- 22- and 24-carbon fatty acids divided by the sum of all 10- to 18-carbon fatty acids) was measured on yeast cells expressing Bay (Bay/pNBT29), Sha (Sha/pNBT29) or no KCS18 protein (pNBT29).

References

    1. Durrett TP, Benning C, Ohlrogge J (2008) Plant triacylglycerols as feedstocks for the production of biofuels. Plant J 54: 593–607. - PubMed
    1. Dyer JM, Stymne S, Green AG, Carlsson AS (2008) High-value oils from plants. Plant J 54: 640–655. - PubMed
    1. Ohlrogge JB, Jaworski JG (1997) Regulation of Fatty Acid Synthesis. Annu Rev Plant Physiol Plant Mol Biol 48: 109–136. - PubMed
    1. Baud S, Lepiniec L (2010) Physiological and developmental regulation of seed oil production. Prog Lipid Res 49: 235–249. - PubMed
    1. Thelen JJ, Ohlrogge JB (2002) Metabolic engineering of fatty acid biosynthesis in plants. Metab Eng 4: 12–21. - PubMed

Publication types

MeSH terms