. 2012;7(11):e49341.
doi: 10.1371/journal.pone.0049341. Epub 2012 Nov 7.

HERV-E-mediated modulation of PLA2G4A transcription in urothelial carcinoma

Affiliations

HERV-E-mediated modulation of PLA2G4A transcription in urothelial carcinoma

Darko Gosenca et al. PLoS One. 2012.

Abstract

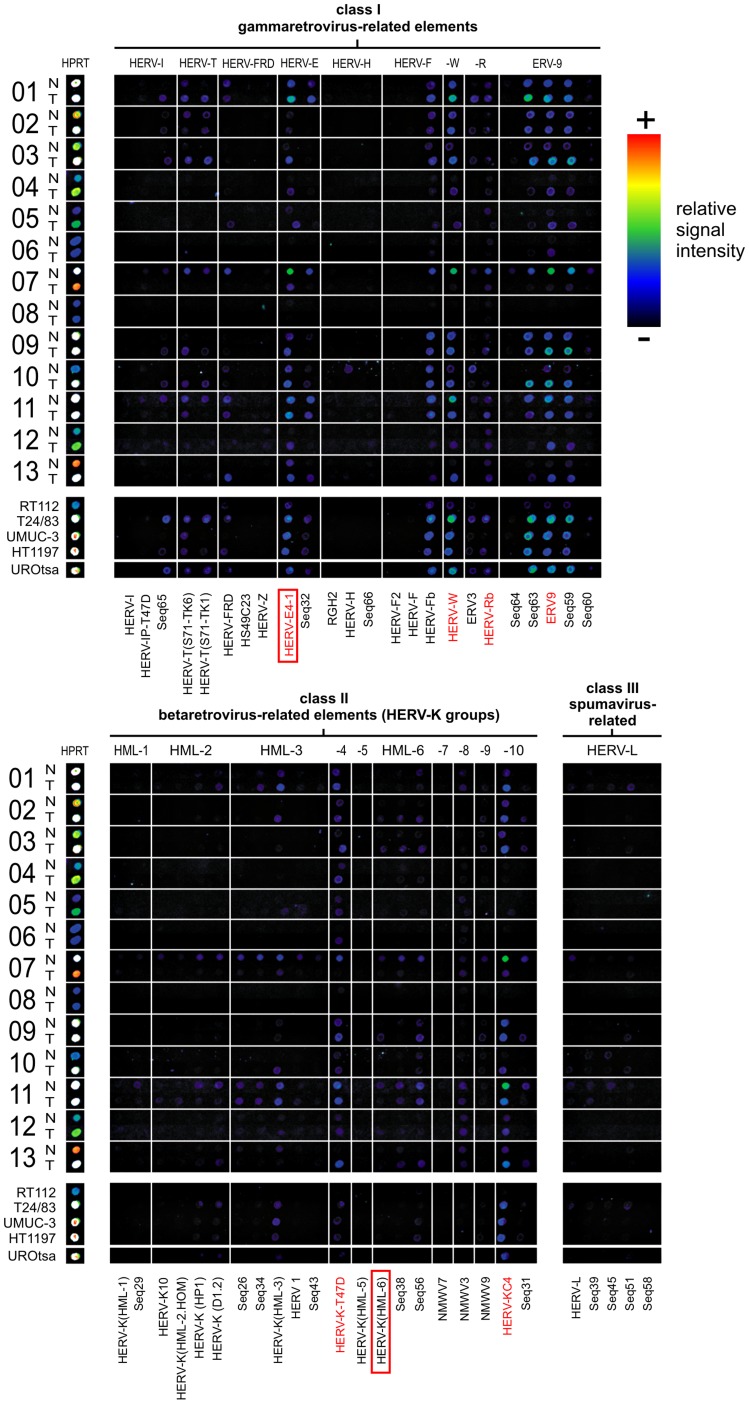
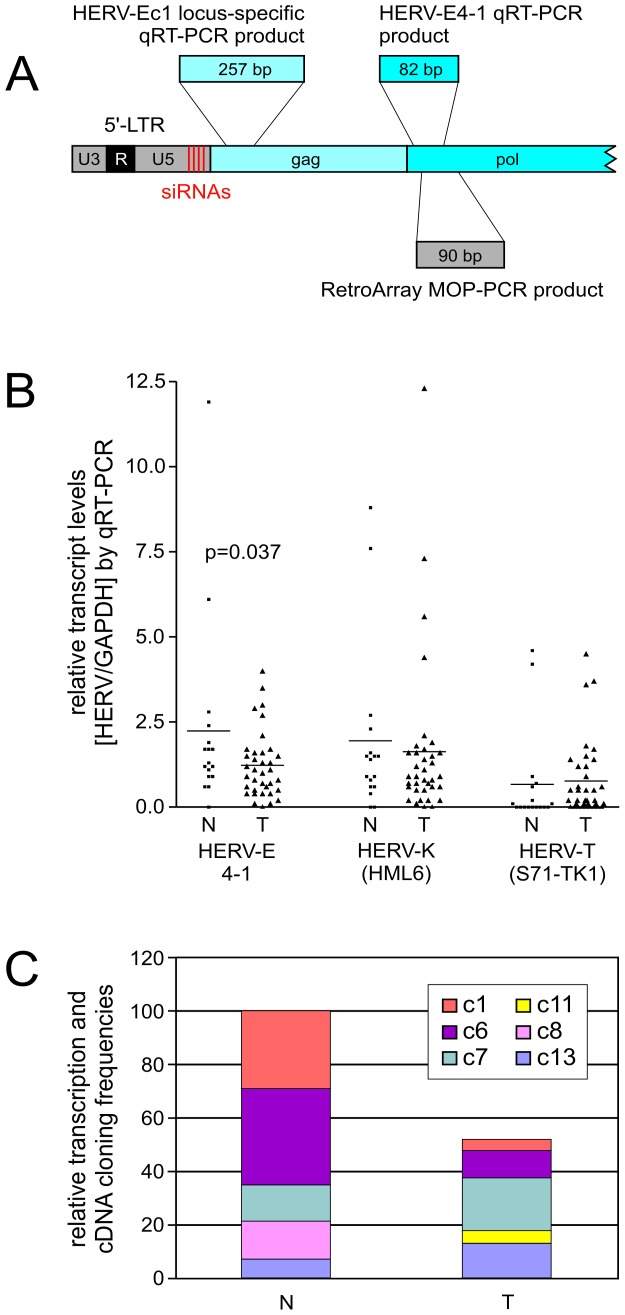
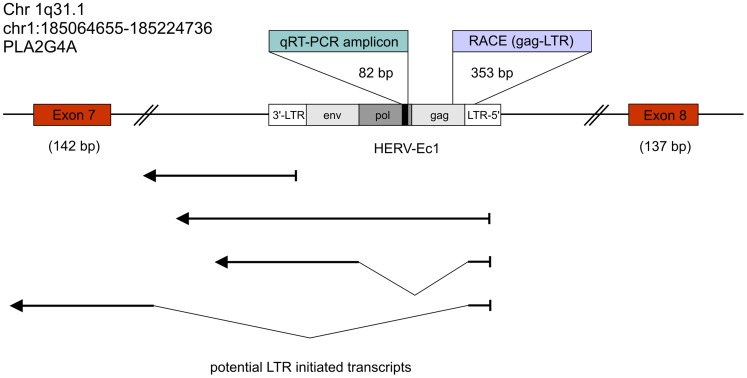
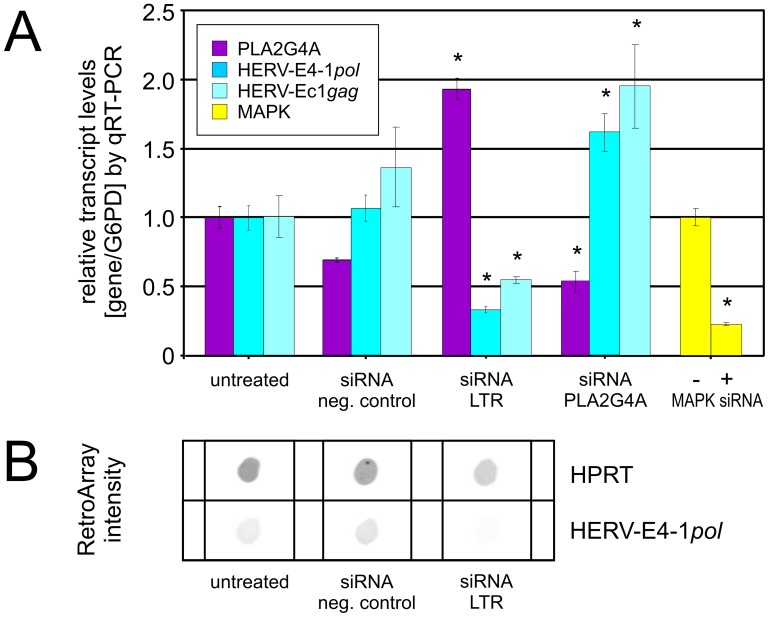
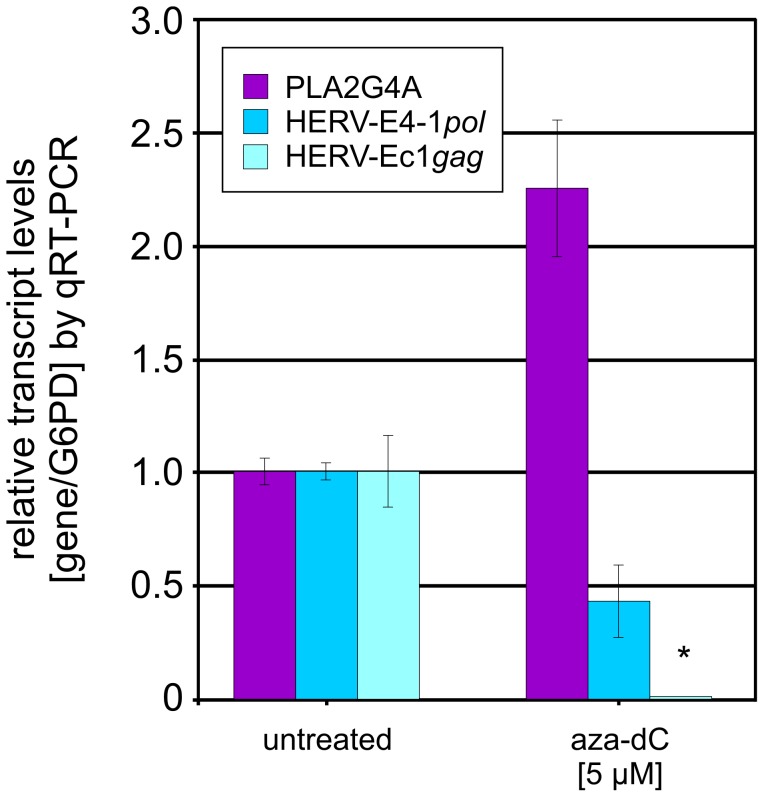
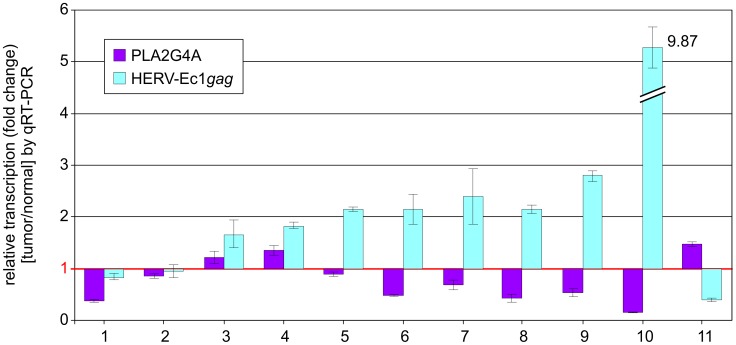
Human endogenous retroviruses (HERV) and related elements account for more than 8% of the human genome and significantly contribute to the human transcriptome by long terminal repeat (LTR) promoter activity. In this context, HERVs are thought to intervene in the expression of adjacent genes by providing regulatory sequences (cis-effect) or via noncoding RNA including natural antisense transcripts. To address the potential impact of HERV activity in urothelial carcinoma, we comparatively analyzed the HERV transcription profiles in paired samples of non-malignant urothelium and urothelial carcinoma derived from 13 patients with bladder cancer by means of a retrovirus-specific microarray (RetroArray). We established a characteristic HERV signature consisting of six ubiquitously active HERV subgroups (E4-1, HERV-Rb, ERV9, HERV-K-T47D, NMWV3, HERV-KC4). The transcription pattern is largely identical in human urothelial carcinoma, non-malignant urothelial tissue, four tumor-derived cell lines and in a non-malignant urothelial cell line (UROtsa). Quantitative reverse transcriptase PCR (qRT-PCR) of HERV-E4-1, HERV-K(HML-6) and HERV-T(S71-TK1) revealed a bias to lower HERV activity in carcinoma samples compared to non-malignant tissue. Determination of active HERV-E4-1 loci by cloning and sequencing revealed six HERV-E4-1 proviral loci that are differentially regulated in urothelial carcinoma cells and normal tissue. Two full-length HERV-E4-1 proviruses, HERV-Ec1 and HERV-Ec6, are located in antisense orientation in introns of the genes PLA2G4A and RNGTT, respectively. PLA2G4A encodes a cytosolic phospholipase A2 (cPLA2) that is dysregulated in many human tumors. PLA2G4A and HERV-Ec1 displayed reciprocal transcript levels in 7 of 11 urothelial carcinoma patients. Moreover, reciprocal shifts were observed after treatment of UROtsa cells with HERV-Ec1 and PLA2G4A-directed siRNAs or 5-aza-2'-deoxycytidine (aza-dC) pointing to an antagonistic regulation of PLA2G4A and HERV-Ec1 transcription in human urothelial cells. We suggest that transcription of HERV-Ec1 contributes to fine tuning of cPLA2 expression, thereby facilitating tumorigenesis.


Conflict of interest statement

Competing Interests: The authors have declared that no competing interests exist.

Figures

Figure 1
Figure 1. HERV transcription activity in patient samples by RetroArray analysis.
HERV activity profiles representing pairs of malignant (T) and non-malignant (N) urothelial tissue specimen, each pair derived from the same patient (n = 13) were digitally aligned. Below, the HERV signatures of four urothelial cancer cell lines (RT112, T24/83, UMUC-3, HT1197) and of the non-malignant urothelial cell line UROtsa are shown. HERV subgroups representing the urothelial core profile are emphasized with red letters. The housekeeping gene hypoxanthine phosphoribosyl transferase (HPRT) served as internal control. For detailed information about the identity of targets and capture probes, see Table S1 and references , . Each positive spot on the microarray represents multiple HERV loci assigned to one subgroup of multicopy elements with sufficient sequence similarity so that individual elements cannot be distinguished. Although false color mapping was used for improved image visualization, weak signals may be unrecognizable in the figure. QRT-PCR was performed for HERV-E4-1, HERV-T(S71-TK1) and HERV-K(HML-6), as depicted by red boxes.
Figure 2
Figure 2. Relative transcript levels of selected HERV elements in patient samples.
(A) Relative positions (not drawn to scale) of siRNAs (red bars) in the HERV-E4-1 5′-LTR. Location and sizes of qRT-PCR and MOP-PCR products (RetroArray) are shown. Given amplicon sizes exclude PCR primers. (B) Quantitative analysis of HERV-E4-1, HERV-K(HML-6) and HERV-T(S71-TK1) transcript levels in cDNA samples derived from 18 non-malignant urothelium (N) and 35 urothelial carcinoma (T) tissue specimen, including 16 paired tissue samples. HERV subgroup-specific pol primers for HERV-E4-1 and HERV-T(S71-TK1), and degenerated pol primers for HERV-K(HML-6) were used. Relative transcript levels were quantified according to Pfaffl . All qRT-PCR values were normalized to GAPDH levels. HERV-E4-1 mean expression of N vs. T was significantly different (p = 0.037; Student’s t-test). (C) Relative cloning frequencies of HERV-E4-1-related cDNAs (as shown in Tab. 3) were combined with the respective HERV-E4-1 qRT-PCR data (Figure 2B) to illustrate the differential activities of transcriptionally active HERV-E4-1 loci in malignant (T) and non-malignant (N) tissues of patient no. 2.
Figure 3
Figure 3. Schematic representation of the PLA2G4A gene locus harboring an intronic HERV-E4-1 element in antisense orientation.
Genomic location (not drawn to scale) of HERV-E4-1 located in the intron of PLA2G4A. The qRT-PCR amplicon (82 bp in length) also represents the cDNA sequence for identifying transcribed HERV-E4-1 loci by using BLAT on the hg18 human reference genome at the UCSC Genome Browser . A 5′-LTR RACE product with a length of 353 bp was detected as described in Materials & Methods. Potential HERV-E4-1 LTR-initiated transcripts are given by bold arrow lines. Potential splicing is depicted by thin lines.
Figure 4
Figure 4. Relative transcript levels of HERV-E4-1 and PLA2G4A in UROtsa cells after siRNA treatment.
Cells were treated with negative control siRNA, HERV-E-LTR-specific siRNA (pool of 4 different siRNAs), and PLA2G4A-specific siRNA. As controls, untreated cells and cells transfected with MAPK-directed siRNA (+ control) were used. (A) QRT-PCR assays were performed on DNA-free RNA samples that were obtained from three independent siRNA transfection experiments. For assessment of HERV-E4-1 transcript levels primers derived from the pol and gag region were used. Transcripts of MAPK and PLA2G4A were analyzed using gene specific primers. While HERV-E4-1 pol-targeting primers overlap with the capture probe of the RetroArray and may amplify several HERV-E4-1 loci, the HERV-Ec1 gag primers are specific for the HERV-Ec1 provirus located in the PLA2G4A gene. Relative transcript levels were normalized to G6PD (housekeeping gene) levels and represent the mean value of at least triplicate qRT-PCR assays. Numbers on the Y-axis show the fold change of transcription. P-values as shown in Figure 4A are given in order from left to right (p = 0.0015, p = 0.009, p = 0.044, p = 0.04, p = 0.0005, p = 0.018, p = 0.0014). (B) RetroArray signal intensity of the same samples showing HPRT (housekeeping gene) and overall HERV-E4-1pol transcript levels.
Figure 5
Figure 5. Effect of aza-dC on transcription of PLA2G4A in UROtsa cells.
UROtsa cells were incubated with 5 µM 5-aza-2-deoxycytidine (aza-dC) for 48 h and analyzed by qRT-PCR in comparison to untreated cells. QRT-PCR assays were performed on DNA-free RNA samples derived from two independent experiments. Primer pairs derived from pol and gag regions were used. While HERV-E4-1 pol-targeting primers overlap the capture probes of the RetroArray and may amplify several HERV-E4-1 loci, the HERV-Ec1 gag primers are specific for the HERV-Ec1 provirus located within intron 7 of the PLA2G4A gene. Transcript levels of PLA2G4A were analyzed using gene-specific primers. Relative transcription levels were normalized to G6PD levels and represent the mean value of six qRT-PCR assays. Numbers on the Y-axis show the fold change of transcription. (*) An almost complete downregulation of HERV-Ec1 gag transcription (0.00027±0.00017%) was observed.
Figure 6
Figure 6. Comparative analysis of HERV-Ec1 gag and PLA2G4A transcription in patients with urothelial carcinoma.
QRT-PCR assays were performed on DNA-free RNA samples obtained from patients with urothelial carcinoma (n = 11). Due to lack of material, additional patients were used not shown in Figures 1 and 2. For measurement of HERV-Ec1 transcripts locus-specific primers derived from the gag region of HERV-Ec1 were utilized. Transcript levels of PLA2G4A were analyzed using a gene specific primer set. Relative transcription levels were normalized to G6PD transcript levels and represent the mean value of triplicate qRT-PCR assays. The numbers on the Y-axis show the fold change of transcription in urothelial carcinoma with respect to corresponding mean value of non-malignant tissue samples (value = 1, depicted by red horizontal line). Thus, values >1 denote increases, values <1 correspond to decreases in transcript levels.

References

    1. Britten R (2006) Transposable elements have contributed to thousands of human proteins. Proc Natl Acad Sci U S A 103: 1798–1803. - PMC - PubMed
    1. Conley AB, Piriyapongsa J, Jordan IK (2008) Retroviral promoters in the human genome. Bioinformatics 24: 1563–1567. - PubMed
    1. Jordan IK, Rogozin IB, Glazko GV, Koonin EV (2003) Origin of a substantial fraction of human regulatory sequences from transposable elements. Trends Genet 19: 68–72. - PubMed
    1. Cohen CJ, Lock WM, Mager DL (2009) Endogenous retroviral LTRs as promoters for human genes: a critical assessment. Gene 448: 105–114. - PubMed
    1. van de Lagemaat LN, Landry J-R, Mager DL, Medstrand P (2003) Transposable elements in mammals promote regulatory variation and diversification of genes with specialized functions. Trends Genet 19: 530–536. - PubMed

Publication types

MeSH terms