

Diversification and population structure in common beans (Phaseolus vulgaris L.)
- PMID: 23145179
- PMCID: PMC3492280
- DOI: 10.1371/journal.pone.0049488
Diversification and population structure in common beans (Phaseolus vulgaris L.)
Abstract
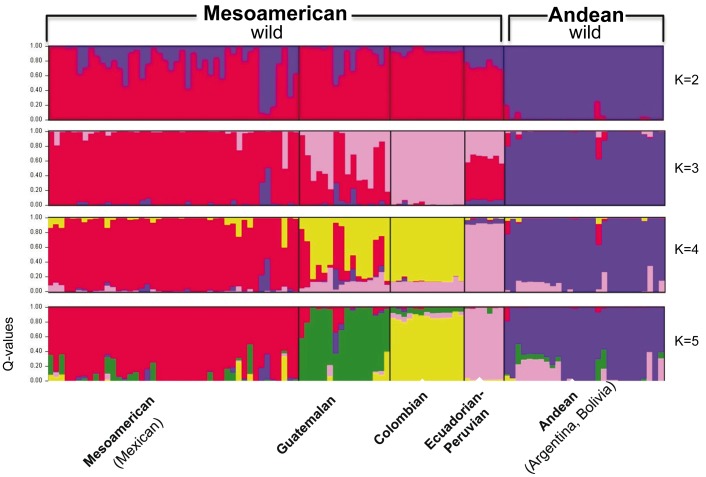
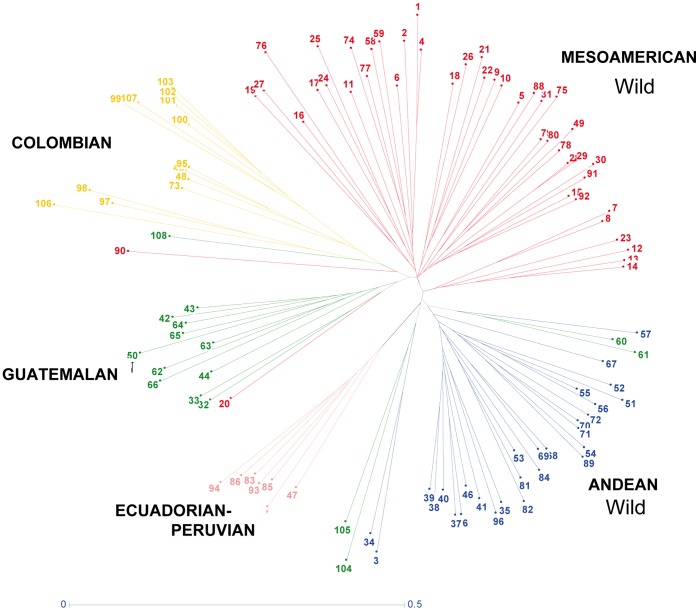
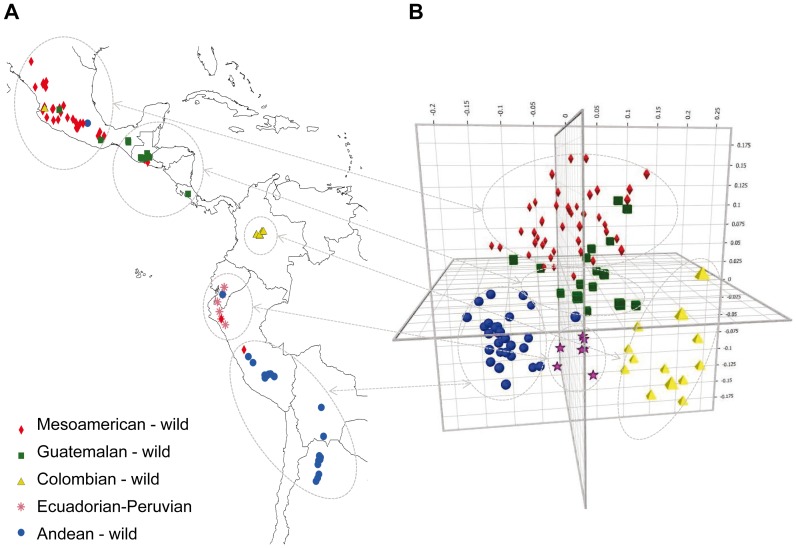
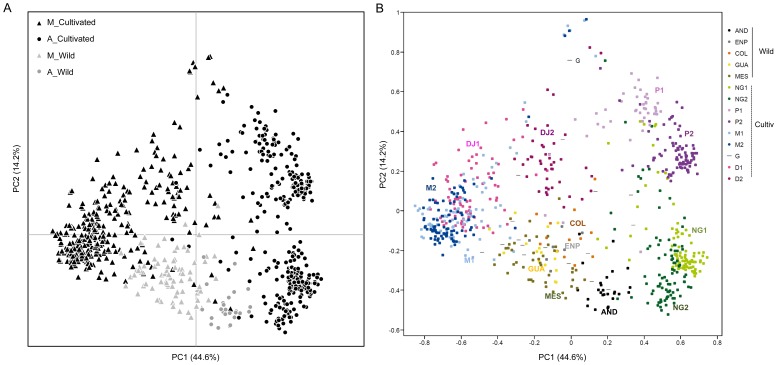
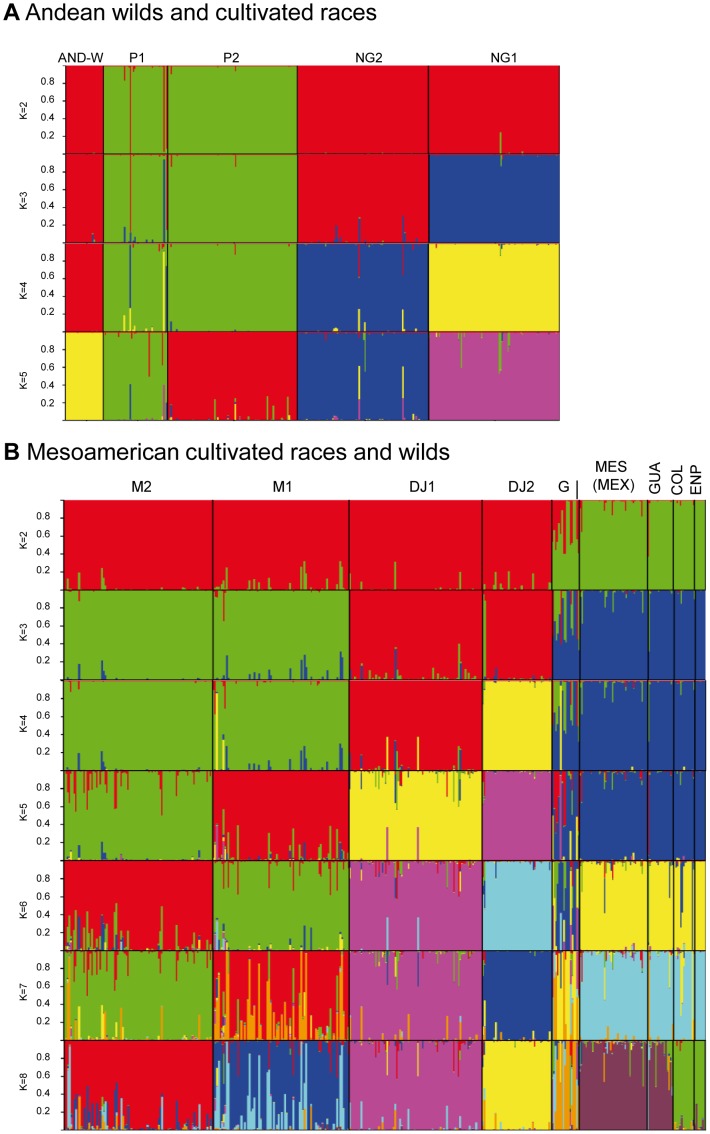
Wild accessions of crops and landraces are valuable genetic resources for plant breeding and for conserving alleles and gene combinations in planta. The primary genepool of cultivated common beans includes wild accessions of Phaseolus vulgaris. These are of the same species as the domesticates and therefore are easily crossable with cultivated accessions. Molecular marker assessment of wild beans and landraces is important for the proper utilization and conservation of these important genetic resources. The goal of this research was to evaluate a collection of wild beans with fluorescent microsatellite or simple sequence repeat markers and to determine the population structure in combination with cultivated beans of all known races. Marker diversity in terms of average number of alleles per marker was high (13) for the combination of 36 markers and 104 wild genotypes that was similar to the average of 14 alleles per marker found for the 606 cultivated genotypes. Diversity in wild beans appears to be somewhat higher than in cultivated beans on a per genotype basis. Five populations or genepools were identified in structure analysis of the wild beans corresponding to segments of the geographical range, including Mesoamerican (Mexican), Guatemalan, Colombian, Ecuadorian-northern Peruvian and Andean (Argentina, Bolivia and Southern Peru). The combined analysis of wild and cultivated accessions showed that the first and last of these genepools were related to the cultivated genepools of the same names and the penultimate was found to be distinct but not ancestral to the others. The Guatemalan genepool was very novel and perhaps related to cultivars of race Guatemala, while the Colombian population was also distinct. Results suggest geographic isolation, founder effects or natural selection could have created the different semi-discrete populations of wild beans and that multiple domestications and introgression were involved in creating the diversity of cultivated beans.
Conflict of interest statement
Figures
References
-
- Broughton WJ, Hernandez G, Blair M, Beebe S, Gepts P, et al. (2003) Beans (Phaseolus spp.) - model food legumes. Plant and Soil 252: 55–128.
-
- Chacon MI, Pickersgill B, Debouck DG, Arias JS (2007) Phylogeographic analysis of the chloroplast DNA variation in wild common bean (Phaseolus vulgaris L.) in the Americas. Plant Systematics and Evolution 266: 175–195.
-
- Miklas PN, Singh SP (2007) Common bean. In: Kole C, editor. Genome mapping and molecular breeding in plants Vol 3. Berlin: Pulses, sugar and tuber crops. Springer Verlag. 1–31.
-
- Kwak M, Gepts P (2009) Structure of genetic diversity in the two major gene pools of common bean (Phaseolus vulgaris L., Fabaceae). Theoretical and Applied Genetics 118: 979–992. - PubMed
Publication types
MeSH terms
Substances
LinkOut - more resources
Full Text Sources
