. 2012;7(11):e49515.
doi: 10.1371/journal.pone.0049515. Epub 2012 Nov 7.

Carboxylesterase1/Esterase-x regulates chylomicron production in mice

Affiliations

Carboxylesterase1/Esterase-x regulates chylomicron production in mice

Ariel D Quiroga et al. PLoS One. 2012.

Abstract

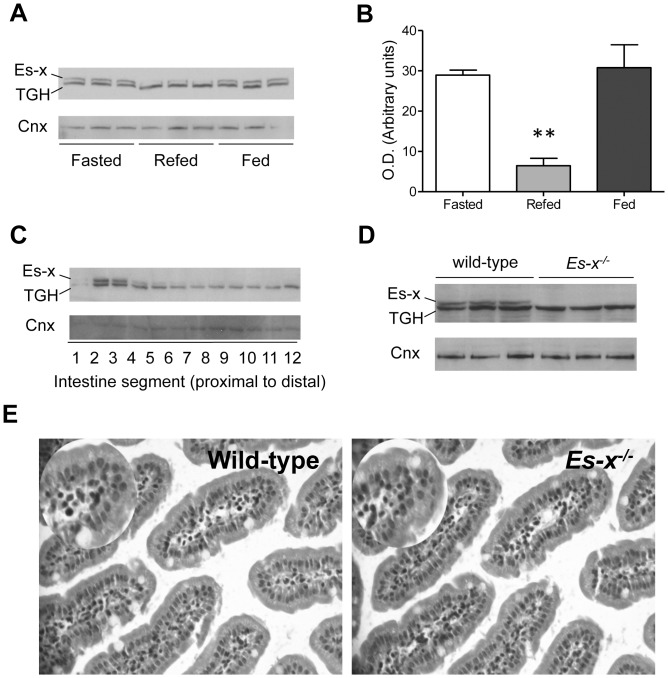
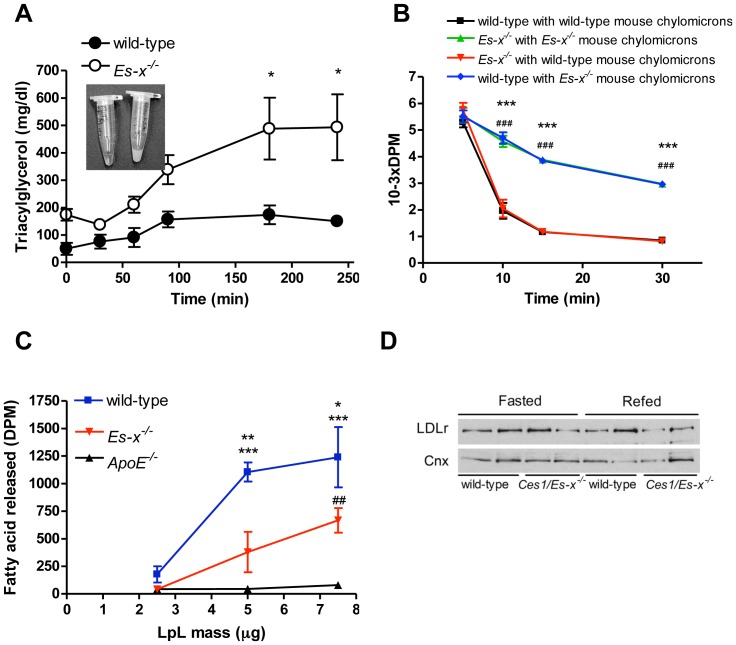
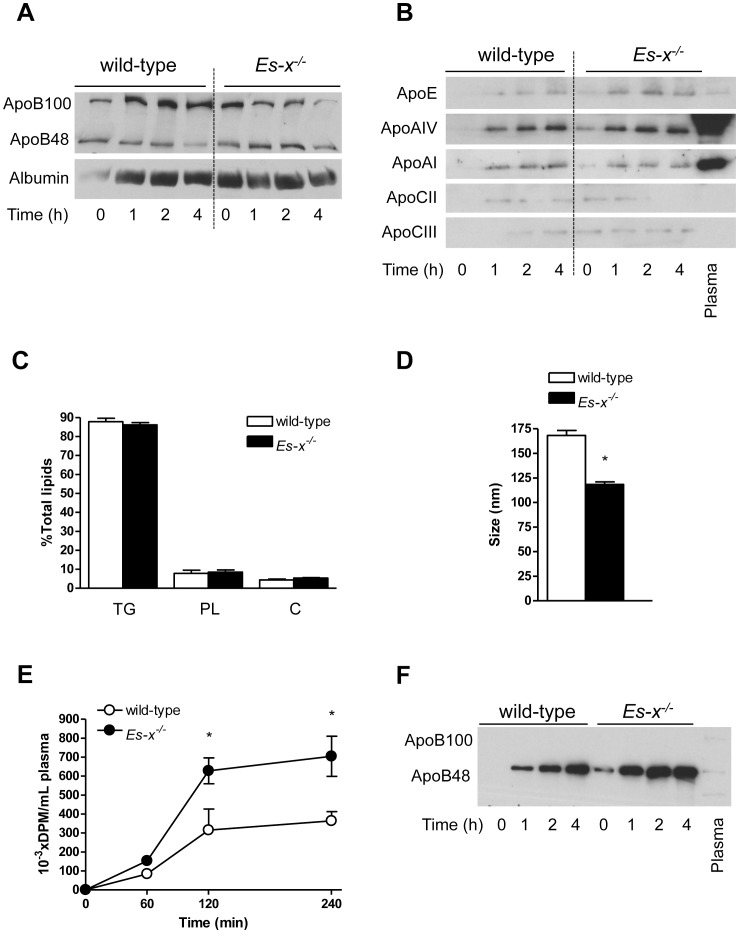
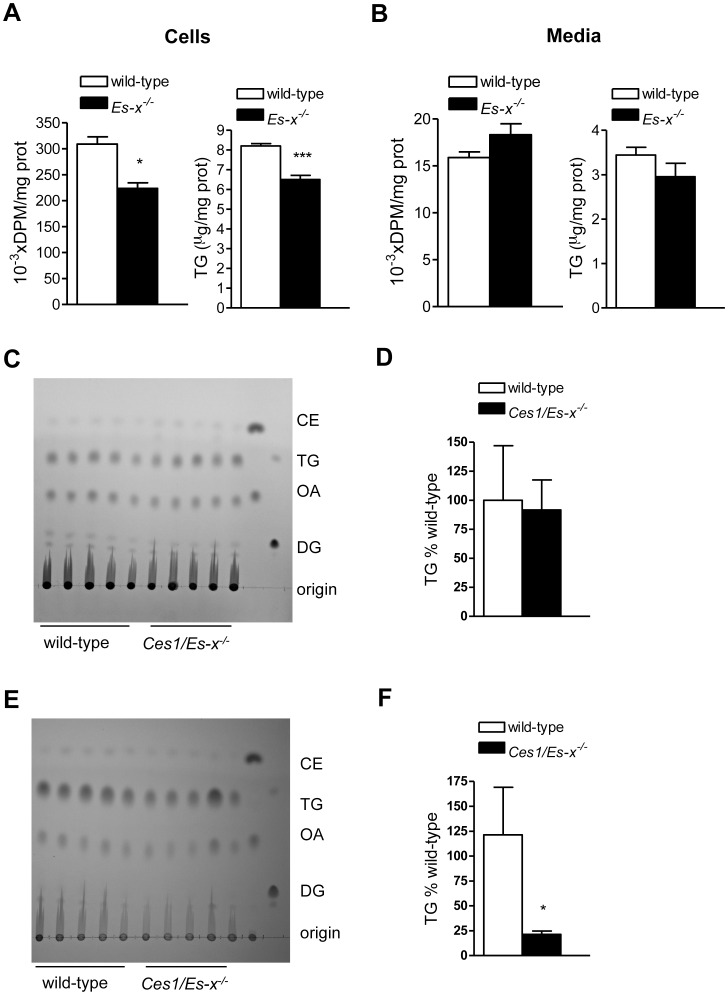
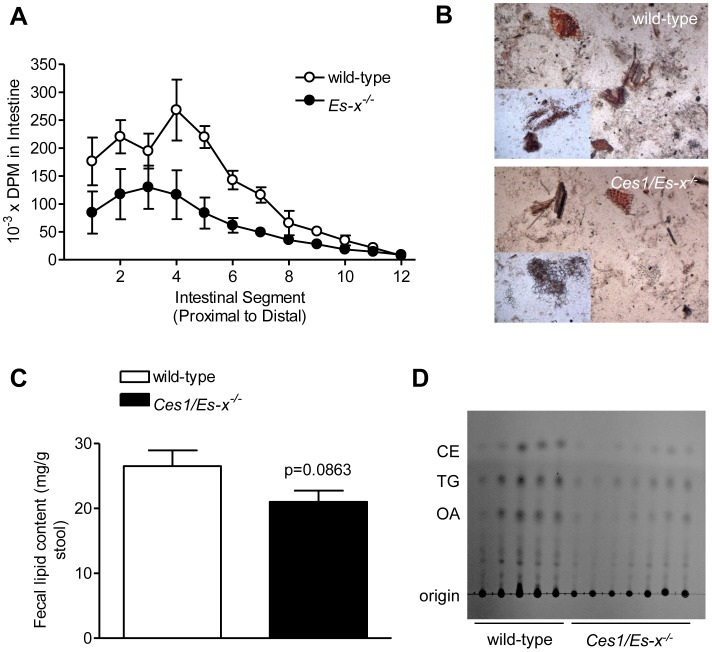
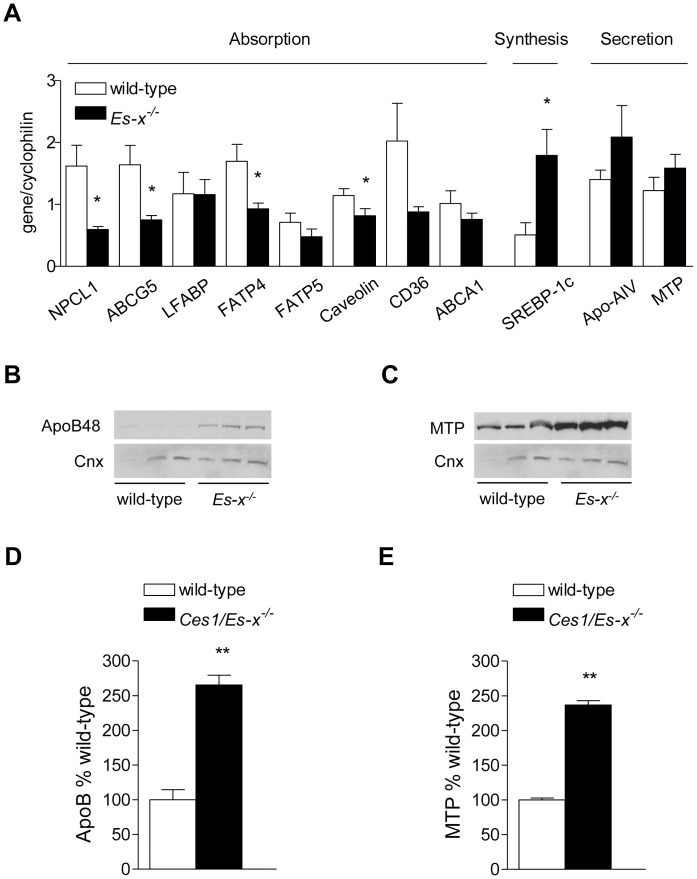
Elevated postprandial plasma triacylglycerol (TG) concentrations are commonly associated with obesity and the risk of cardiovascular disease. Dietary fat contributes to this condition through the production of chylomicrons. Carboxylesterases have been mainly studied for their role in drug metabolism, but recently they have been shown to participate in lipid metabolism; however, their role in intestinal lipid metabolism is unknown. Carboxylesterase1/esterase-x (Ces1/Es-x) deficient mice become obese, hyperlipidemic and develop hepatic steatosis even on standard chow diet. Here, we aimed to explore the role of Ces1/Es-x in intestinal lipid metabolism. Six-month old wild-type and Ces1/Es-x deficient mice were maintained on chow diet and intestinal lipid metabolism and plasma chylomicron clearance were analyzed. Along the intestine Ces1/Es-x protein is expressed only in proximal jejunum. Ablation of Ces1/Es-x expression results in postprandial hyperlipidemia due to increased secretion of chylomicrons. The secreted chylomicrons have aberrant protein composition, which results in their reduced clearance. In conclusion, Ces1/Es-x participates in the regulation of chylomicron assembly and secretion. Ces1/Es-x might act as a lipid sensor in enterocytes regulating chylomicron secretion rate. Ces1/Es-x might represent an attractive pharmacological target for the treatment of lipid abnormalities associated with obesity, insulin resistance and fatty liver disease.


Conflict of interest statement

Competing Interests: The authors have declared that no competing interests exist.

Figures

Figure 1
Figure 1. Intestinal Ces1/Es-x expression is regulated by nutritional status.
(A) Intestinal Ces1/Es-x protein expression in different nutritional states. Mice were fasted for 24 h and refed for 6 h. Fasted and refed mice were euthanized at 8:00 P.M. TGH is a related carboxylesterase migrating at a lower Mr due to lesser glycosylation and is recognized by the polyclonal anti-Ces1/Es-x antibodies. Two µg intestinal proteins were subjected to analysis. Cnx, calnexin  =  loading control. (B) Quantitation of Ces1/Es-x immunoreactive bands obtained in different nutritional states. **p<0.01 Refed vs Fasted. (C) Ces1/Es-x protein distribution along the small intestine. Small intestine was cut into 12 pieces 2-cm long. Proteins were separated by SDS-PAGE and immunodetected with anti-Ces1/Es-x antibodies. Representative data from 3 different independent experiments are shown. (D) Absence of Ces1/Es-x protein (immunoblot) in the intestine from Ces1/Es-x −/− mice. (E) H&E staining of small intestine (200×) sections.
Figure 2
Figure 2. Impaired chylomicron clearance in Ces1/Es-x−/− mice.
(A) Fat tolerance test in 12-h fasted mice. Mice were gavaged with 150 µl olive oil. Blood samples were collected at the indicated times, plasma was prepared and TG concentrations were measured by gas chromatography. N = 4–6 mice/group. Inset shows plasma appearance 4 h after the lipid load (wild-type on the left and Ces1/Es-x−/− on the right). *p<0.05 vs. wild-type. (B) Chylomicron clearance. Labeled chylomicrons were isolated from plasma of wild-type and Ces1/Es-x−/− mice and injected into abdominal veins of mice of both genotypes. Blood samples were collected, plasma prepared and radioactivity measured by scintillation counting. N = 6 mice/group. ***p<0.001 black line vs. blue line, ###p<0.001 green line vs. red line. (C) In vitro lipolysis of chylomicrons from wild-type, Ces1/Es-x−/− and ApoE−/− mice by isolated LpL. N = 3 mice/group. Details about the procedure are given in the main text. *p<0.05 vs. Es-x −/−, **p<0.01 vs. Es-x −/−; ***p<0.001 vs. ApoE−/−, ##p<0.01 vs. ApoE−/−. (D) Immunobotting showing hepatic LDLr protein expression from fasted and re-fed (6 h) mice.
Figure 3
Figure 3. Chylomicrons from Ces1/Es-x−/− mice present with abnormal composition.
(A) Immunoblotting showing plasma apolipoprotein B composition from mice injected with P-407. Plasma samples were prepared at the indicated times. Representative data from 3 independent experiments. (B) Immunoblotting showing apolipoprotein composition of chylomicrons isolated from wild-type and Ces1/Es-x−/− mice. Representative data from 3 independent experiments. (C) Chylomicron lipid composition. Chylomicrons were isolated lipids extracted and levels measured using commercial kits. N = 5 mice/group. PL, glycerophospholipids; C, total cholesterol. (D) Chylomicron size. Chylomicrons were isolated from wild-type and Ces1/Es-x−/− mice and size was evaluated by dynamic light scattering at 25°C. N = 5 mice/group, 5 measurements per sample. (E) Chylomicron secretion. Overnight fasted mice were injected with P-407, followed by an olive oil bolus containing radiolabeled triolein. Blood was collected at the indicated times and plasma prepared. Lipids were extracted, spotted onto TLC plates and resolved. Lipids were visualized by exposure to iodine, and radioactivity in TG was counted in a scintillation counter. N = 6 mice/group, *<p0.05 vs. wild-type. (F) Chylomicron apolipoprotein B secretion rate. Chylomicrons were collected through lymph duct cannulation. Proteins from 2 µL of lymph were resolved by SDS-5%PAGE and immunoblotted for apoB. Plasma control (1 µL) in the farthest right lane.
Figure 4
Figure 4. Lower TG accumulation in enterocytes from Ces1/Es-x−/− mice.
(A) and (B) Enterocytes from fasted mice were isolated and incubated with micelles containing radiolabeled oleic acid. Cellular radiolabel incorporation into TG and media radiolabeled TG secretion were assessed by lipid extraction, TLC separation, iodine exposure and scintillation counting. Cellular and media TG mass was measured by gas chromatography. N = 4 mice/group, *p<0.05, ***p<0.001. (C) Lipid content in intestinal mucosal scrapings from mice fasted overnight and re-fed for 6 h. Lipid standards in the last two lanes on the right are: DG, diacylglycerol (dioleoylglycerol); OA, oleic acid, TG, triacylglycerol (triolein), CE, cholesteryl ester (cholesteryl oleate). (D) Quantitation of the TG band in (C). (E) Lipid content in intestinal mucosal scrapings from mice fasted overnight. Lipid standards in the last two lanes on the right are as in (C). (F) Quantitation of the TG band in (E). *p<0.05 vs. wild-type.
Figure 5
Figure 5. Decreased intestinal TG accumulation and absence of fat malabsorption in Ces1/Es-x−/− mice.
(A) Uptake of dietary fat along the length of the small intestine. Mice were fasted for 4 h and gavaged with radiolabeled triolein diluted in olive oil. Two hours later, the small intestine was excised, flushed, cut, digested and radioactivity associated with the intestinal segments was determined. N = 3 mice/group. (B) Fat in stools. Sudan III staining of stool fat upon spontaneous defecation in fed mice. (C) Analysis of fat in stools by organic extraction after spontaneous defecation. N = 5–7 mice/group. (D) Fecal lipids analyzed by TLC. N = 5–7 mice/group.
Figure 6
Figure 6. Decreased expression of lipid absorption and increased expression of lipid secretion markers in Ces1/Es-x−/− mice.
(A) Intestinal expression of lipid absorption, synthesis and secretion genes in intestines from 24-week old mice was analyzed by qPCR. Mice were fasted for 4 h. N = 5 mice/group. *p<0.05 vs. wild-types. (B) Immunoblot of intestinal ApoB48. (D) Immunoblot of intestinal MTP. Same animals as in (A) were used. Cnx, calnexin  =  loading control. (D) and (E) quantitation of the immunoreactive ApoB48 and MTP bands, respectively. **p<0.01 vs. wild-type.

References

    1. Nordestgaard BG, Benn M, Schnohr P, Tybjaerg-Hansen A (2007) Nonfasting triglycerides and risk of myocardial infarction, ischemic heart disease, and death in men and women. JAMA 298: 299–308. - PubMed
    1. Goldberg IJ, Eckel RH, McPherson R (2011) Triglycerides and heart disease: still a hypothesis? Arterioscler Thromb Vasc Biol 31: 1716–1725. - PMC - PubMed
    1. Quiroga AD, Li L, Trotzmuller M, Nelson R, Proctor SD, et al.. (2012) Deficiency of carboxylesterase 1/esterase-x in mice results in obesity, hepatic steatosis and hyperlipidemia. Hepatology. doi: 10.1002/hep.25961. - PubMed
    1. Wei E, Ben Ali Y, Lyon J, Wang H, Nelson R, et al. (2010) Loss of TGH/Ces3 in mice decreases blood lipids, improves glucose tolerance, and increases energy expenditure. Cell Metab 11: 183–193. - PubMed
    1. Yen CL, Cheong ML, Grueter C, Zhou P, Moriwaki J, et al. (2009) Deficiency of the intestinal enzyme acyl CoA:monoacylglycerol acyltransferase-2 protects mice from metabolic disorders induced by high-fat feeding. Nat Med 15: 442–446. - PMC - PubMed

Publication types