. 2011;2(1):13-49.
doi: 10.1068/i0396. Epub 2011 Mar 9.

Object knowledge modulates colour appearance

Affiliations

Object knowledge modulates colour appearance

Christoph Witzel et al. Iperception. 2011.

Abstract

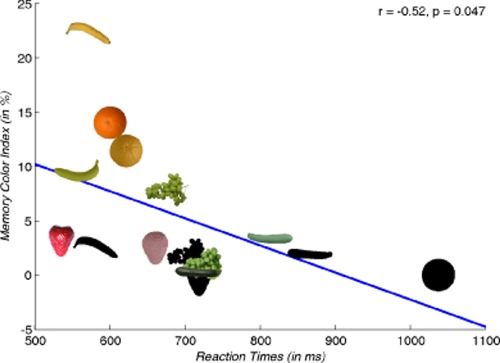
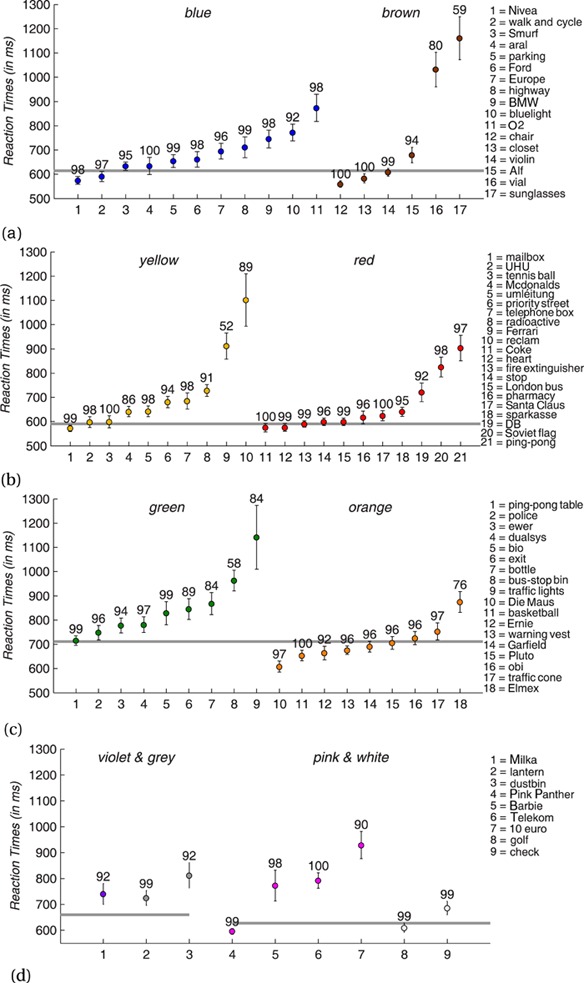
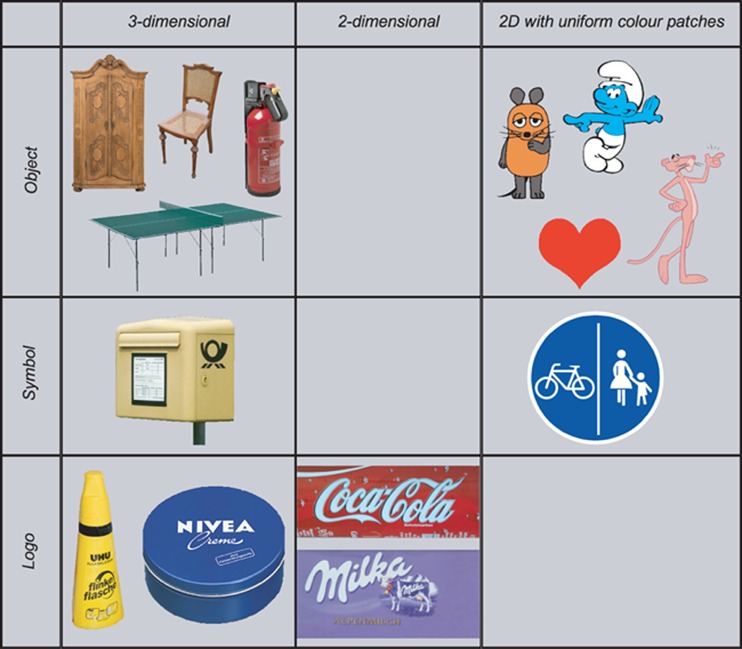
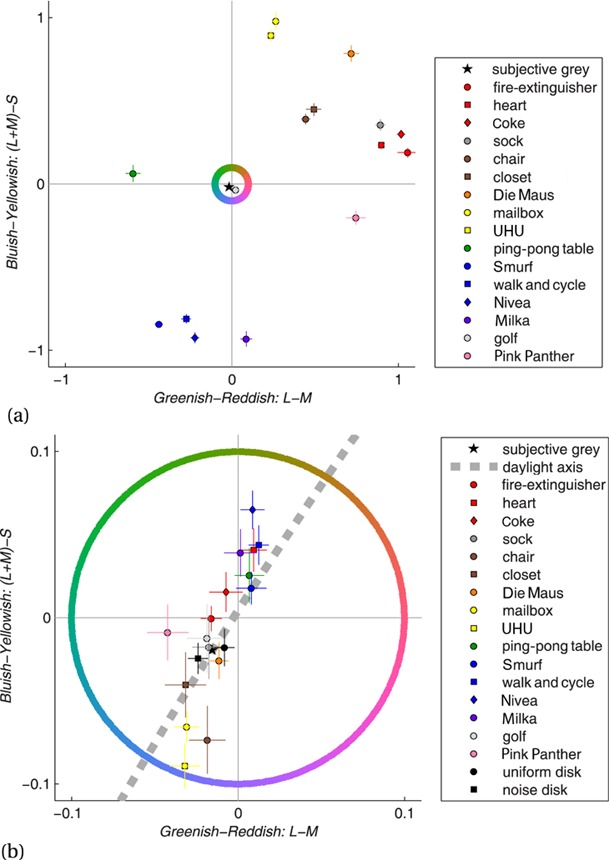
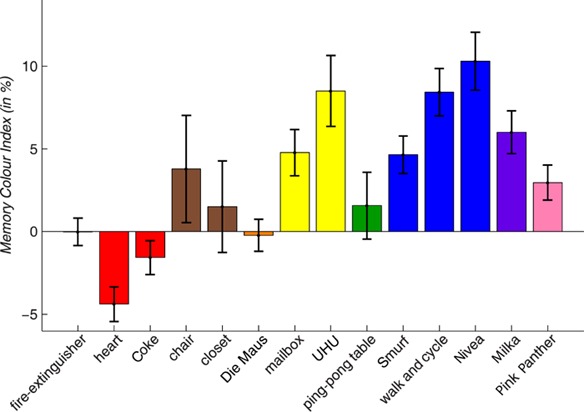
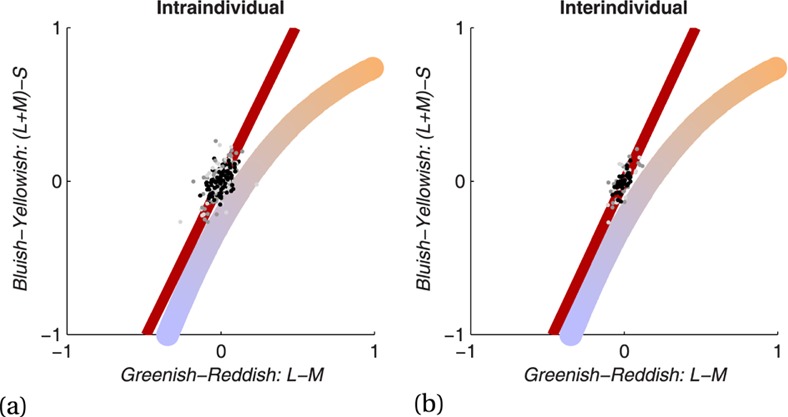
We investigated the memory colour effect for colour diagnostic artificial objects. Since knowledge about these objects and their colours has been learned in everyday life, these stimuli allow the investigation of the influence of acquired object knowledge on colour appearance. These investigations are relevant for questions about how object and colour information in high-level vision interact as well as for research about the influence of learning and experience on perception in general. In order to identify suitable artificial objects, we developed a reaction time paradigm that measures (subjective) colour diagnosticity. In the main experiment, participants adjusted sixteen such objects to their typical colour as well as to grey. If the achromatic object appears in its typical colour, then participants should adjust it to the opponent colour in order to subjectively perceive it as grey. We found that knowledge about the typical colour influences the colour appearance of artificial objects. This effect was particularly strong along the daylight axis.

Keywords: Artificial Objects; Colour Appearance; Colour Diagnosticity; Daylight Variation; Memory Colours; Object Colours; Past Experience; Prior Knowledge.


Figures

Figure 1.
Figure 1.
Correlation between reaction times and memory colour effects for the stimuli used in the second part of the first experiment in Olkkonen et al (2008). The x-axis shows the reaction times measured as indices for colour diagnosticity and recognisability. The y-axis shows the memory colour effect as measured through the memory colour index.
Figure 2.
Figure 2.
Reaction times and accuracy rates for candidate objects. The different parts of the figure correspond to the category pairings (cf table 2). The x-axis lists the artificial objects of each category in the order of their average reactions times. The y-axis represents reaction times in ms for correct responses. Coloured disks show reaction times averaged over thirty-one participants; the respective error bars depict standard errors of mean. The grey line corresponds to the median reaction time of the whole category pair, that is, including the natural objects. Category pairs are: (a) blue–brown, (b) yellow–red, (c) green–orange, and (d) violet–grey and pink–white.
Figure 3.
Figure 3.
Features of the fourteen colour diagnostic stimuli used in the colour adjustment experiment. Columns show how the stimuli vary in the complexity of their perceptual features. Stimuli on the right depict three-dimensional objects with a texture and a complex colour distribution. Stimuli on the left are two dimensional and consist merely of uniformly coloured areas. The two stimuli in the centre column are two dimensional, but have a texture and a complex colour distribution. Rows represent the degree of abstractness of the identificatory feature. Stimuli in the top row are objects. This implies that they represent themselves. The main features of the stimuli in the centre and in the bottom row are symbols or writings, respectively. They have to be interpreted symbolically. Moreover, they refer to abstract ideas such as a traffic rule in the case of the traffic sign or a company identity in the case of the brand logos.
Figure 4.
Figure 4.
Adjustments for each object in DKL colour space. The DKL space is scaled so that along the axes an absolute value of 1 corresponds to the monitor gamut. The coloured ring represents hue variation along the azimuth in DKL colour space. It is shown with a radius of value 0.1 in both graphics. In this way, it also indicates the difference in scale between the two graphics. The coloured symbols show the adjustments, averaged over repetitions and participants. The lines crossing the disks are the standard errors of mean for the x-axis and y-axis across participants. The black pentagram represents the average subjective grey-point. (a) Typical adjustments for each object. (b) Achromatic adjustments for each object. The DKL space is zoomed in to values between −0.1 and 0.1. The dashed grey line is the daylight axis, shifted so that the correlated colour temperature of 6500 (standard illuminant d65) falls into the subjective grey point. Figure (a) shows that participants adjusted the correct typical colours quite reliably. In figure (b) the shifts of the achromatic adjustments are stronger along the daylight axis. A comparison of the corresponding symbols in figures (b) and (a) shows that most achromatic adjustments were shifted towards the opposite direction of the typical adjustments as assumed for the memory colour effect.
Figure 5.
Figure 5.
Memory colour indices (MCIs) for each object. Bars show the MCI in percent averaged over participants. Error bars represent standard errors of mean. Bars are ordered according to the azimuth of the objects' typical colours. Double asterisks (∗∗) indicate that the average MCI of the respective object is significantly different from zero in a paired one-sided t-test across participants and with an alpha of 0.01. Congruent with the memory colour effect, for ten out of fourteen objects the MCI is higher than zero, and for seven of these objects this difference was significant. For the heart the MCI is significantly lower than zero. However, across all objects the MCI is still significantly above zero, thus confirming the pattern of the memory colour effect.
Figure 6.
Figure 6.
Variability of achromatic adjustments for control stimuli. The dots represent the single adjustments of four control stimuli: The two kinds of disks (black dots), the golf ball (light grey), and the colour-neutral sock (dark grey). The red curve is the principal component that represents the main common variation of x and y values. In order to illustrate daylight variation, the correlated colour temperature is shown as a curve that is coloured according to the actual hues that correspond to the coordinates. (a) Intraindividual variability: the coloured dots depict the single adjustments for all participants after subtraction of the respective participant's mean. (b) Interindividual variability: the coloured dots show the average adjustments for each object and each participant.

References

    1. Active Wire Inc. Active Wire (Version 1.0.14) Palo Alto, CA: Active Wire Inc; 2003.
    1. Adams GK. An experimental study of memory color and related phenomena. The American Journal of Psychology. 1923;34:359–407.
    1. Adobe Systems Inc. Adobe Photoshop CS2 (Version 9.0.1) San Jose, CA: Adobe; 2005.
    1. Baker KE, Mackintosh I. The influence of past associations upon attributive color judgments. Journal of Experimental Psychology. 1955;49:281–286. doi: 10.1037/h0044052. - DOI - PubMed
    1. Bartleson CJ. Memory colors of familiar objects. Journal of the Optical Society of America. 1960;50:73–77. doi: 10.1364/JOSA.50.000073. - DOI - PubMed

LinkOut - more resources