. 2012 Oct;2(10):2600-14.
doi: 10.1002/ece3.350. Epub 2012 Sep 14.

Large-scale longitudinal gradients of genetic diversity: a meta-analysis across six phyla in the Mediterranean basin

Affiliations

Large-scale longitudinal gradients of genetic diversity: a meta-analysis across six phyla in the Mediterranean basin

Cyrille Conord et al. Ecol Evol. 2012 Oct.

Abstract

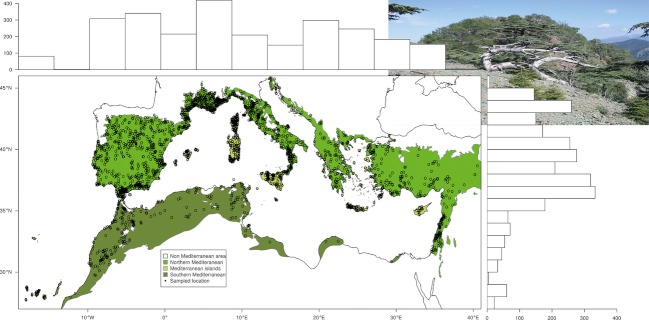
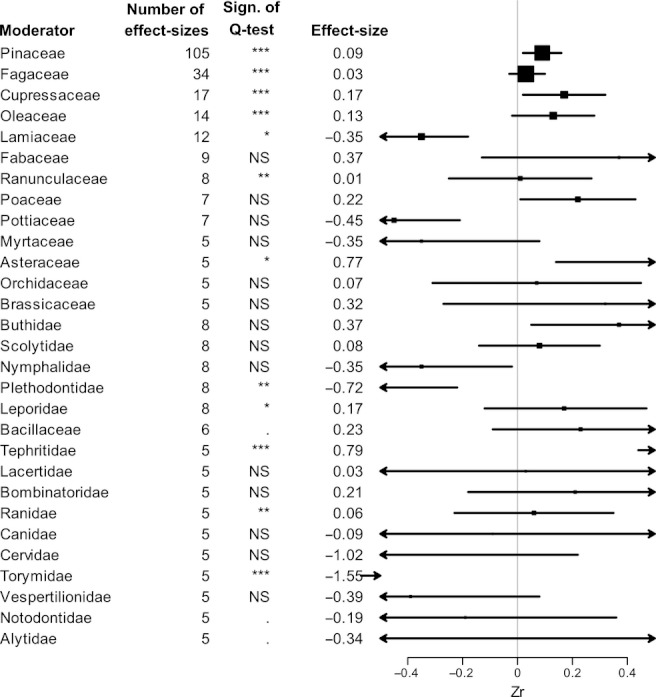
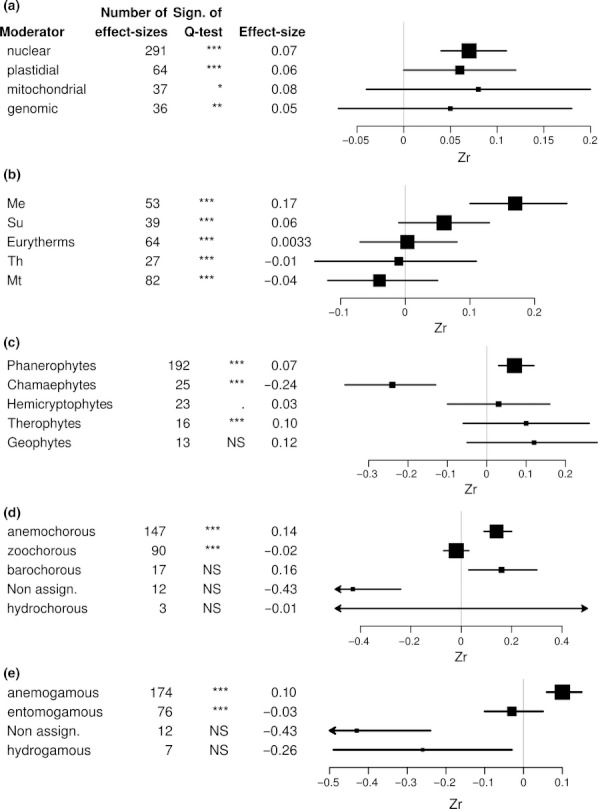
Biodiversity is the diversity of life at all scales, from genes to ecosystems. Predicting its patterns of variation across the globe is a fundamental issue in ecology and evolution. Diversity within species, that is, genetic diversity, is of prime importance for understanding past and present evolutionary patterns, and highlighting areas where conservation might be a priority. Using published data on the genetic diversity of species whose populations occur in the Mediterranean basin, we calculated a coefficient of correlation between within-population genetic diversity indices and longitude. Using a meta-analysis framework, we estimated the role of biological, ecological, biogeographic, and marker type factors on the strength and magnitude of this correlation in six phylla. Overall, genetic diversity increases from west to east in the Mediterranean basin. This correlation is significant for both animals and plants, but is not uniformly expressed for all groups. It is stronger in the southern than in the northern Mediterranean, in true Mediterranean plants than in plants found at higher elevations, in trees than in other plants, and in bi-parentally and paternally than in maternally inherited DNA makers. Overall, this correlation between genetic diversity and longitude, and its patterns across biological and ecological traits, suggests the role of two non-mutually exclusive major processes that shaped the genetic diversity in the Mediterranean during and after the cold periods of the Pleistocene: east-west recolonization during the Holocene and population size contraction under local Last Glacial Maximum climate in resident western and low elevation Mediterranean populations.

Keywords: Arthropod; Bryophyte; Chordata; Holocene; Mollusc; Pleistocene; Pteridophyte; Spermaphyte; biodiversity; biogeography; genetic diversity; longitude; meta-analysis; past climate; phylogeography; recolonization.


Figures

Figure 1
Figure 1
Map of the Mediterranean Basin showing the eco-climatic envelope as defined by Olson et al. (2001) and the geographic partition (North vs. South vs. islands) tested in our study. Each black circle represents a location sampled in the meta-analyzed raw studies. Histograms for latitudinal and longitudinal distributions of locations sampled in raw studies are given above and to the right of the map. The photographed tree in the upper right corner is a Cedrus brevifolia individual on a ridge in its natural habitat of the Trohodos mountains of Cyprus.
Figure 2
Figure 2
(a) Mean effect-sizes across the Mediterranean basin and for different biogeographic envelopes. Each square, whose size is proportional to the number of effect-sizes, indicates mean values and each bar the 95% confidence interval around the mean. Bars not intercepting the Y-axis indicate a significant correlation between GDpop and longitude. When the mean is on the positive side of the X-axis, this correlation is positive, indicating that GDpop increases from west to east. Bars with arrows indicate that the 95% confidence interval falls outside the limits of the figure. Diamonds highlight mean values for plants and animals. All Q-tests are highly significant (P < 0.0001), indicating that significant differences between effect-sizes remain within each biogeographic category. Nota bene: northern/southern and continent/island effect-sizes do not add up to the total number of effect-sizes in the Mediterranean basin because raw data studies may include species with populations present north and south of the Mediterranean and both on continents and on islands. (b) Mean effect-sizes across the Mediterranean basin for five plant and eight animal classes, and mean values for the plant and animal kingdoms. Classes are arranged in decreasing effect-size order. Square and error bars should be interpreted as indicated for (a).
Figure 3
Figure 3
Mean effect-sizes across the Mediterranean basin for 12 plant and 17 animal families, arranged in decreasing effect-size number per category. Of 62 possible families represented in the dataset, only the 29 with a number of effect-sizes over 5 are represented here. Square and error bars should be interpreted as indicated for Fig. 2a.
Figure 4
Figure 4
Square and error bars should be interpreted as indicated for Fig. 2a. (a) Mean effect-sizes across the Mediterranean basin for marker type. The category “genomic” refers to unassigned marker types. (b) Mean effect-sizes (ordered from most positive to most negative) of Mediterranean basin plants for ecological requirements. The categories refer to altitudinal belts where plant species are predominantly found: “Me” is meso-Mediterranean, “Su” is supra-Mediterranean, “Eurytherms” refers to plant species found across several altitudinal belts, “Th” is thermo-Mediterranean and “Mt” is mountain-Mediterranean (see Quézel and Médail 2003). Square and error bars should be interpreted as indicated for Fig. 2a. Nota bene: effect-sizes for ecological requirements do not add up to the total number of effect-sizes in plants because raw data communicated by some authors were pooled at the genus level or because data included species for which we were not able to retrieve their ecological requirement. (c) Mean plant effect-sizes (arranged in decreasing effect-size frequency per category) across the Mediterranean basin for Raunkiaer biological types. Phanerophytes are woody plants with over-wintering buds situated over 50 cm from the ground, chamaephytes are low-growing perennials (often woody plants) with wintering buds below 50 cm in height, hemicryptophytes are (often 2-year cycle) perennials with ground-level wintering buds, geophytes are plants with bulbs or rhizomes (wintering buds below ground level), and therophytes are annuals (wintering organs as seeds). Nota bene: Bryophytes were not assigned a Raunkiaer type (nine effect-sizes). (d) Mean plant effect-sizes (arranged in decreasing effect-size frequency per category) across the Mediterranean basin for seed dispersal types. Anemochorous plants have wind-dispersed seeds, zoochorous plants animal-dispersed seeds, barochorous plants gravity-dispersed seeds, and hydrochorous plants water-dispersed seeds. (e) Mean plant effect-sizes (arranged in decreasing effect-size frequency per category) across the Mediterranean basin for pollen dispersal types. Anemogamous plants have wind-dispersed pollen, entomogamous plants insect-dispersed pollen, and hydrogamous plants water-dispersed pollen.

References

    1. Aloe AM, Becker BJ. Teacher verbal ability and school outcomes: where is the evidence? Educ. Res. 2009;38:612–624.
    1. Van Andel TH. The climate and landscape of middle part of Weichselian glaciation in Europe: the stage 3 project. Quatern. Res. 2002;57:2–8.
    1. Aravanopoulos FA, Panetsos KP, Skaltsoyiannes A. Genetic structure of Pinus brutia stands exposed to wild fires. Plant Ecol. 2004;171:175–183.
    1. Atkinson RJ, Rokas A, Stone GN. Longitudinal patterns in species richness and genetic diversity in European oaks and oak gallwasps. In: Weiss S, Ferrand N, editors. Phylogeography of southern European refugia. Dordrecht, The Netherlands: Springer; 2007. pp. 127–151.
    1. Avise JC. Phylogeography: the history and formation of species. Cambridge, MA, USA: Harvard University Press; 2000. p. 447.

LinkOut - more resources