. 2012 Oct 28;2(26):9707-9726.
doi: 10.1039/C2RA20337E.

Chemistry with spatial control using particles and streams()

Affiliations

Chemistry with spatial control using particles and streams()

Yevgeniy V Kalinin et al. RSC Adv. .

Abstract

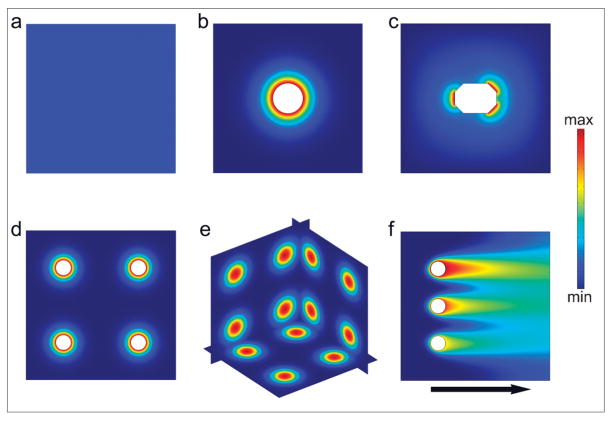
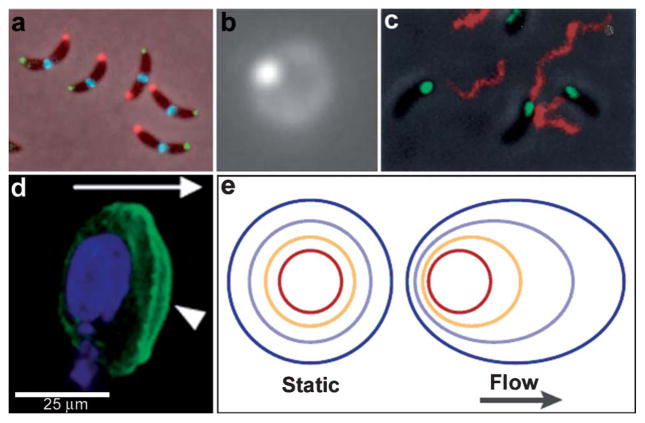
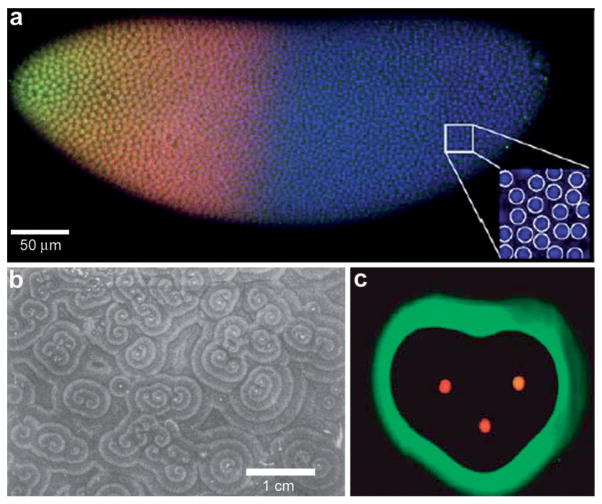
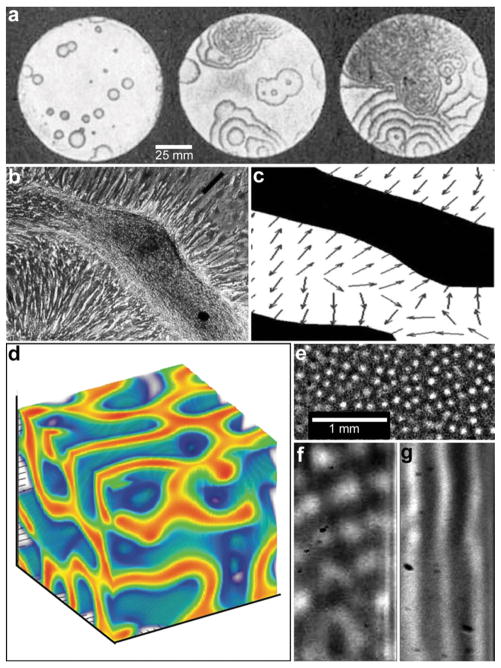
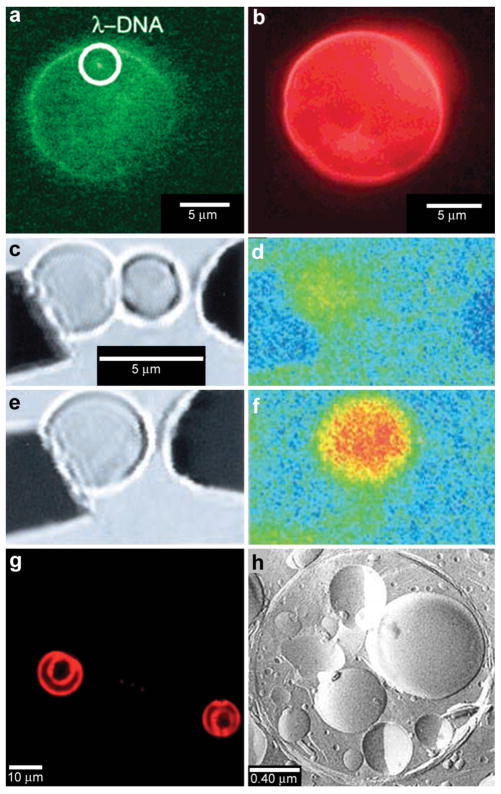
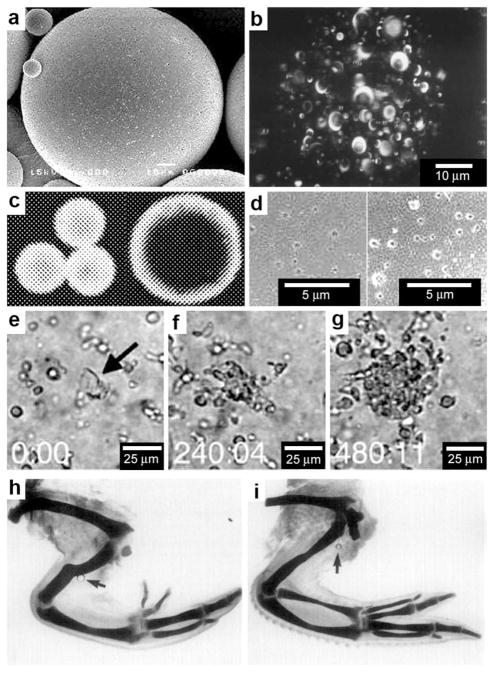
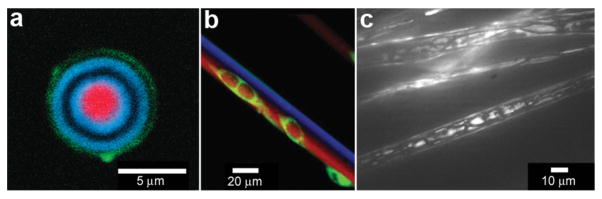
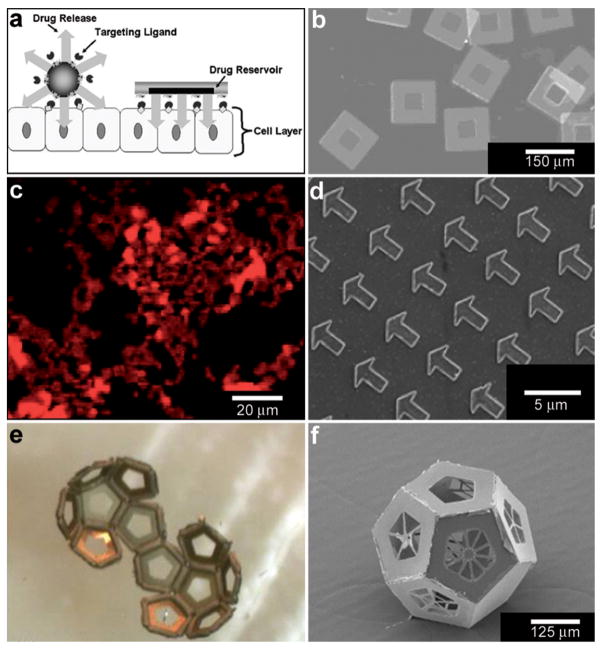
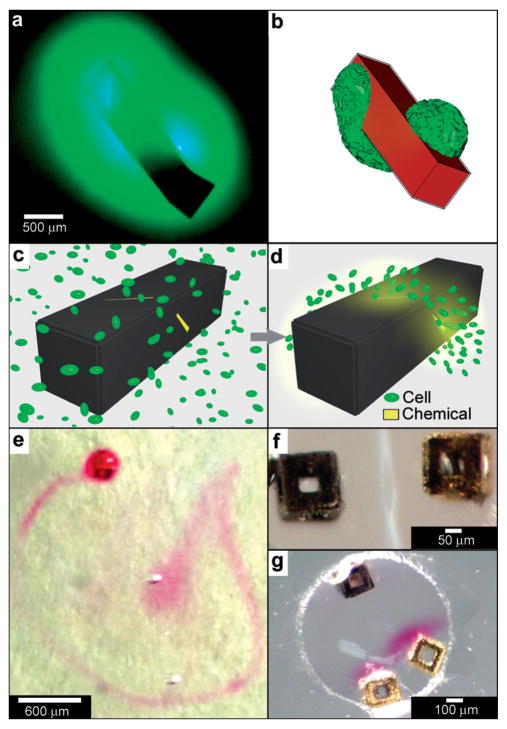
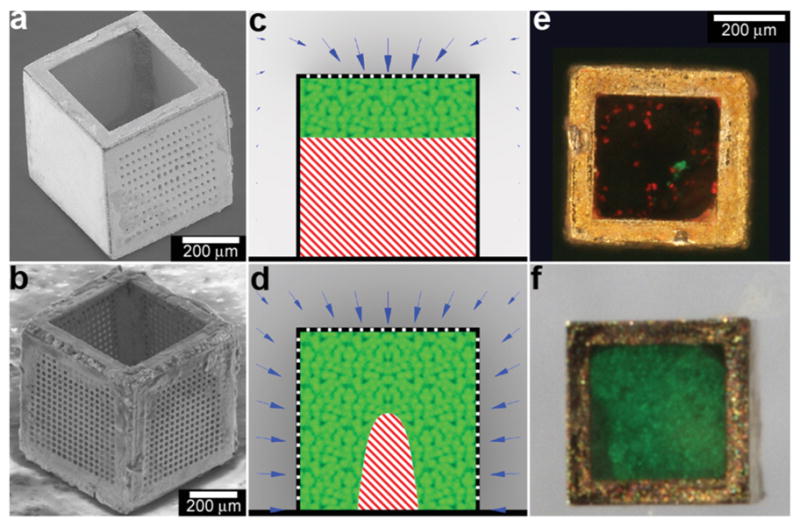
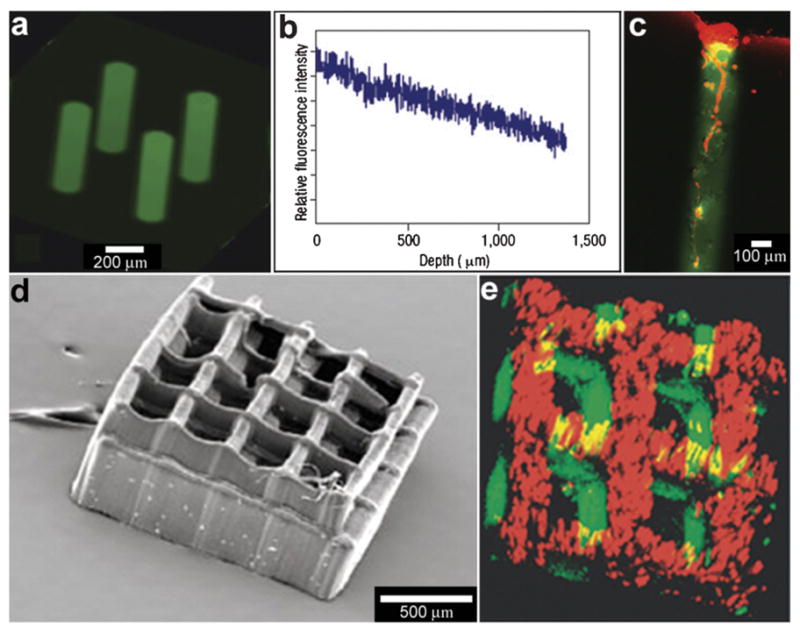
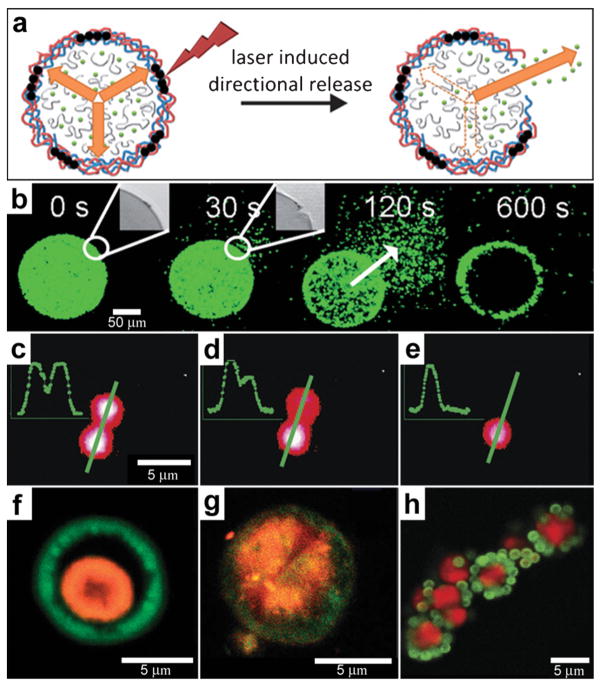
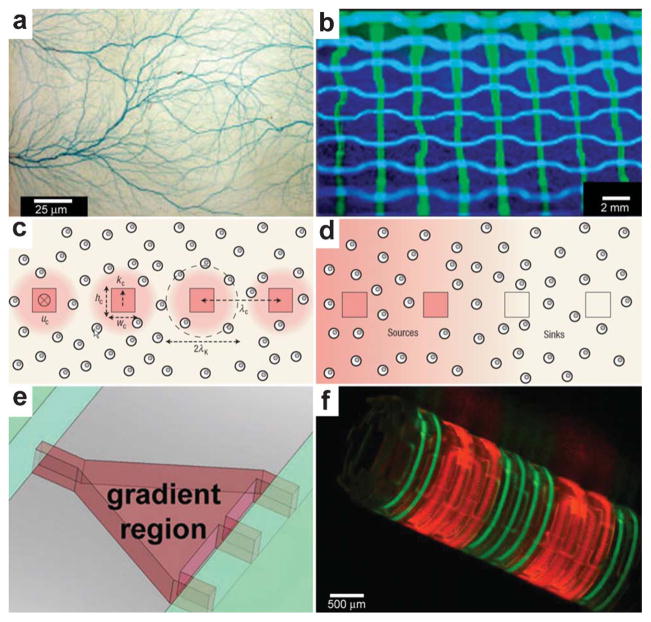
Spatial control of chemical reactions, with micro- and nanometer scale resolution, has important consequences for one pot synthesis, engineering complex reactions, developmental biology, cellular biochemistry and emergent behavior. We review synthetic methods to engineer this spatial control using chemical diffusion from spherical particles, shells and polyhedra. We discuss systems that enable both isotropic and anisotropic chemical release from isolated and arrayed particles to create inhomogeneous and spatially patterned chemical fields. In addition to such finite chemical sources, we also discuss spatial control enabled with laminar flow in 2D and 3D microfluidic networks. Throughout the paper, we highlight applications of spatially controlled chemistry in chemical kinetics, reaction-diffusion systems, chemotaxis and morphogenesis.


Figures

Fig. 1
Fig. 1
Schematic illustration of chemical fields generated by particles and streams. (a) Homogeneous chemical field. (b) Radially symmetric chemical field generated by a single particle source. (c) Asymmetric chemical field generated by a single particle source. (d) 2D array of radially-symmetric particulate sources. (e) 3D array of spherically symmetric chemical sources. (f) Chemical field generated by three sources releasing the same chemical with different concentration in a flowing stream.
Fig. 2
Fig. 2
Examples of chemical patterning at the single cell level. (a) An anterior-posterior cellular localization axis is exhibited by the Caulobacter histidine kinases PleC (red) and DivJ (green) that dynamically and selectively localize to specific cell poles. The ZapA cell division protein (blue) localizes to the FtsZ ring. (Reprinted with permission from ref. . Copyright (2009) by The American Association for the Advancement of Science). (b) Live streptococcal cells (seen in the image as a diffuse ring) secrete enzymatically active SpeB at a single locus (brighter spot in the image). Representative micrograph shows that each cell displays a single punctate fluorescent locus. (Reprinted with permission from ref. . Copyright (2004) by The American Association for the Advancement of Science). (c) Co-localization of expression of Eps apparatus (green) and flagellum (red) at the same pole in the cells of Vibrio cholerae. The bacteria were visualized by phase-contrast microscopy. (Reprinted with permission from ref. . Copyright (2001) by The National Academy of Sciences, USA). (d) Staining of fixed samples with phalloidin demonstrates directional reorganization and membrane localization (arrowheads) of the actin cytoskeleton in a flow-dependent manner. (Reprinted with permission from ref. . Copyright (2007) by Elsevier.) (e) An idealized steady-state concentration profile of a secreted chemokine surrounding a cell (centered in the red ring) under interstitial flow. The color indicates the concentration range of the secreted molecule, from 100% of the secreted concentration (red) to 0% (dark blue). (Reprinted with permission from ref. . Copyright (2005) by The Nature Publishing Group).
Fig. 3
Fig. 3
Examples of chemical patterning at the multi-cellular level. (a) Scanning confocal microscope image of a Drosophila embryo in early nuclear cycle, stained for DNA (blue), Hb (red), and Bcd (green); scale bar 50 μm. Inset (28 × 28 μm2) shows how DNA staining allows for automatic detection of nuclei. (Reprinted with permision from ref. . Copyright (2007) by Elsevier.) (b) Organized waves of cell movement during aggregation in Dictyostelium discoideum. (Reprinted with permission from ref. . Copyright (1981) by The American Association for the Advancement of Science). (c) Experimental result showing heart-shaped GFP patterns formed based on the placement and initial concentrations of sender cells (three sender disks are shown in the image in red color) expressing DsRed-Express. (Reprinted with permission from ref. . Copyright (2005) by The Nature Publishing Group).
Fig. 4
Fig. 4
Reaction-diffusion chemical patterns in 2D and 3D. (a) Photographs of a concentration wave propagation in two-dimensional self-oscillatory chemical system. The images were taken at 4 min intervals. Ring diameter equals 100 mm. (Reprinted with permission from ref. . Copyright (1970) by The Nature Publishing Group). (b) Pattern formation in cultured Vascular Mesenchymal Cells (VMCs) in vitro. Over 20 days, VMCs develop from a monolayer of randomly oriented cells (not shown in the figure) of nearly uniform density to a ridge with the perpendicular orientation of cells in the monolayer relative to the edges of the multicellular ridge. The black bar in (b) shows the approximate size, shape, and orientation of a single cell. (Reprinted with permission from ref. . Copyright (2004) by The National Academy of Sciences, USA). (c) Numerical solutions corresponding to the experimental image shown in (b). Model results are displayed as levels of one of the chemicals involved (the activator) with black representing high and white representing low levels. Gray arrows depict the direction field of gradients of the activator concentration, which corresponds to the perpendicular orientation of cells in culture. (Reprinted with permission from ref. . Copyright (2004) by The National Academy of Sciences, USA). (d) 3D steady state patterns of VMCs obtained in simulations of pattern formation of the cells arising from their interaction with Bone Morphogenic Protein-2 (BMP-2) and its inhibitor, Matrix Gla Protein (MGP) in three dimensions. In 3D, the steady state patterns produced are highly interconnected tubes which have planar surfaces. (Reprinted with permission from ref. 52). (e–g) Tomographic study of the Belousov-Zhabotinsky reaction: snapshots of stationary 2D spots (e) in a thin layer and 2D images of the corresponding 3D structures (f) and (g). Bright regions correspond to high concentrations of the oxidized form of the catalyst. (Reprinted with permission from ref. . Copyright (2011) by The American Association for the Advancement of Science).
Fig. 5
Fig. 5
Chemical reactions with vesicles and spherical capsules. (a,b) Fluorescence photographs of λ-DNA-loaded (green, shown in (a)) liposome (red, shown in (b)). (Reprinted with permission from ref. . Copyright (2005) by The American Chemical Society). (c–f) Chemical reactions in merging lipid vesicles. (c, e) Electrofusion (about 75 kV cm−1; 10 μs) of a 10 μM fluo-3 containing vesicle (left) and a 10 μM Ca2+ containing vesicle (right) under bright-field illumination. Corresponding fluorescence images are shown in (d) and (f). Binding of Ca2+ by fluo-3 increases the fluorescence quantum yield of this chelator by about 40-fold as was indeed observed. (Reprinted with permission from ref. . Copyright (1999) by The American Association for the Advancement of Science). (g) A light scanning confocal microscope (LSCM) image of multivesicle assembly. (Reprinted with permission from ref. . Copyright (2008) by John Wiley and Sons). (h) A transmission electron microscopy (TEM) image of a multicompartment structure, the vesosome, formed from a lipid mixture. Multiple small vesicle compartments are visible inside one of more exterior bilayers. (Reprinted with permission from ref. . Copyright (2004) by Bentham Science Publishers Ltd.).
Fig. 6
Fig. 6
Chemical patterning with polymer microspheres. (a) Surface scanning electron (SEM) micrograph of a polymer microsphere. (Reprinted with permission from ref. . Copyright (2000) by Elsevier). (b) Three-dimensional confocal microscopy image depicting the spherical-occlusion structure of a single PLGA microsphere and localization of (fluorescently labeled) drug along the periphery of the occlusions. (Reprinted with permission from ref. . Copyright (1997) by John Wiley and Sons). (c) Laser scanning confocal microscopy cross-sections through the midline of 20 μm and 40 μm rhodamine-loaded microspheres, revealing increasing surface distribution of rhodamine as microsphere diameter increases. (Reprinted with permission from ref. . Copyright (2003) by Springer). (d) Surface scanning electronic micrographs of microspheres prepared at 38 °C and 4 °C respectively. (Reprinted with permission from ref. . Copyright (2000) by Elsevier). (e–g) Three frames from a time-lapse imaging experiment showing chemotaxis of dendritic cells into direct contact with one isolated large PLGA microsphere (denoted in the first frame by black arrow) filled with a chemoattractant. Elapsed times (min:s) are shown in the lower left of each frame. (Reprinted with permission from ref. . Copyright (2005) by Elsevier). (h,i) Chick wings that developed following the application of a range of doses (0.5 μg ml−1 for (h) and 0.1 mg ml−1 for (i)) of all-trans-retinoic acid from AGl-X2 beads (beads are indicated by arrows). Wing digit patterns vary depending on the concentration of all-trans-retinoic acid. (Reprinted with permission from ref. . Copyright (1985) by Academic Press).
Fig. 7
Fig. 7
Chemical patterning with complex and non-spherical polymer particles and fibers. (a) A CLSM image of a single five-compartment particle which contained three enzymes placed in separated compartments. The image shows the particle after the coupled reaction has completed. Reprinted with permission from ref. . Copyright (2010) by The American Chemical Society). (b) A CLSM image of a bicompartmental microfiber. Acetylene-PLGA was incorporated in the red compartment only followed by selective peptide conjugation resulting in cell (shown in green) adhesion alongside the red compartment only. (Reprinted with permission from ref. . Copyright (2009) by John Wiley and Sons). (c) FITC-BSA-encapsulated polymer (PCLEEP) electrospun fibers. (Reprinted with permission from ref. . Copyright (2005) by The American Chemical Society).
Fig. 8
Fig. 8
Lithographically-structured and self-assembled containers. (a) Schematic representation of a spherical particle and lithographically-fabricated microdevice interface with intestinal epithelial cell surface. This illustration displays the advantages of a microfabricated drug delivery particle over traditional spherical particles: asymmetric release of drug, multi-site targeting for flow stability, and drug reservoir protection can be engineered into the design of the microdevice. (Reprinted from ref. with permission from The Royal Society of Chemistry). (b) Light micrograph of detached SU-8 microdevices without hydrogel. (Reprinted from ref. with permission from The Royal Society of Chemistry). (c) Fluorescence images of cubic (side length 2 μm), Doxorubicin-loaded Trojan horse particles produced using the PRINT technique. (Reprinted with permission from ref. . Copyright (2008) by The American Chemical Society). (d) Manipulation of shape using PRINT: 3 μm arrow PEG particles. (Reprinted with permission from ref. . Copyright (2005) by The American Chemical Society). (e) Video snapshots featuring the hierarchical self-assembly of a 500 μm dodecahedron. (Reprinted with permission from ref. . Copyright (2009) by IOP Publishing Ltd.). (f) An SEM image of a folded 3D dodecahedron container featuring anisotropic surface patterning (i.e., different specific desired patterns on each panel). (Reprinted with permission from ref. . Copyright (2009) by IOP Publishing Ltd.).
Fig. 9
Fig. 9
Curved, anisotropic and dynamic chemical patterns created by self-assembled microcontainers. (a, b) Generation of 3D spatial patterns by varying pore placement on self-assembled microcontainers. Experimental optical image (a) and numerical simulation (b) of the helical spatial pattern of fluorescein emerging from the container. (Reprinted with permission from ref. . Copyright (2011) by John Wiley and Sons). (c, d) Conceptual representation of chemotactic self-organization of motile cells in the shape of the underlying chemical pattern. At the start of the experiment, the chemoattractant is confined to the container, and the cells (represented by green ellipsoids) are distributed uniformly throughout the medium (c). The cells then self-organize in a helical pattern based on the chemical pattern once the chemoattractant (yellow) is allowed to diffuse out of the container (d). (Reprinted with permission from ref. . Copyright (2011) by John Wiley and Sons). (e) Optical images showing remotely guided spatially controlled chemical pattern. In this case the container was remotely guided using magnetic fields. The letter G was formed by the direct writing of phenolphthalein in an alkaline water-glycerol medium. (Reprinted with permission from ref. . Copyright (2006) by The American Chemical Society). (f) Spatially controlled chemical reactions between multiple containers: reaction of copper sulfate and potassium hydroxide in an aqueous medium resulting in the formation of copper hydroxide along the central line between the containers. (Reprinted with permission from ref. . Copyright (2006) by The American Chemical Society). (g) Reaction of phenolphthalein (diffusing out of the two bottom containers) and potassium hydroxide (diffusing out of the top container) in an aqueous medium. (Reprinted with permission from ref. . Copyright (2006) by The American Chemical Society).
Fig. 10
Fig. 10
Three dimensional nutrient patterning inside polyhedral micro-containers. (a, b) Electron microscopy images of a self-assembled one porous-faced (a) and five porous-faced (b) microcontainers. The open face at the top of the containers is used for cell loading and it is sealed during the experiment. (Reprinted from ref. with permission from The Royal Society of Chemistry). (c, d) Numerical simulations of spatial variation of viable (green) and necrotic (red) cells within a micro-container with (c) one porous face and (d) a microcontainer with porosity on all faces except the one at the bottom (similar to the containers shown in (a, b)). The O2 concentration outside the microcontainers is color coded with darker gray colors indicating lower O2 concentrations. The arrows represent the diffusive flux of O2 in the medium surrounding the microcontainer. (Reprinted from ref. with permission from The Royal Society of Chemistry). (e, f) Representative images of 500 μm sized microcontainers with one porous face (e) and five porous faces (f) removed from the cell culture medium and opened for inspection after 7 days. Cells were stained using the live/dead (green/red) assay. Microcontainer with one porous face showed significant numbers of dead cells (e) while those with five porous faces (f) showed high cell viability. (Reprinted from ref. with permission from The Royal Society of Chemistry).
Fig. 11
Fig. 11
Laser-assisted immobilization of chemicals within polymer matrices. (a) Biochemical channels synthesized in agarose hydrogels and characterized with a fluorescein-tagged GRGDS peptide. (Reprinted with permission from ref. . Copyright (2004) by The Nature Publishing Group). (b) The longitudinal fluorescence intensity profile along the central axis of the channel shows a decrease in fluorescent intensity with depth, indicating a concentration gradient of oligopeptide. (Reprinted with permission from ref. . Copyright (2004) by The Nature Publishing Group). (c) Primary rat dorsal root ganglia cells were plated on 3D patterned GRGDS oligopeptide-modified agarose gels. Three days after plating, DRG cells grew within GRGDS-oligopeptide-modified agarose channels only, and not in surrounding volumes. A cell cluster on top of a GRGDS channel shows cell migration into the channel and extension of a process into the oligopeptide-modified channel as viewed by confocal fluorescent microscopy, where the channel is green (due to a fluorescein-labeled oligopeptide) and the cells are red (due to the cytoskeletal F-actin rhodamine-phalloidin stain). (Reprinted with permission from ref. . Copyright (2004) by The Nature Publishing Group). (d, e) Laser-fabricated 3D polymer structure (d) with two chemicals incorporated into it (e). (Reprinted with permission from ref. . Copyright (2005) by John Wiley and Sons).
Fig. 12
Fig. 12
Chemical patterning with optically responsive particles. (a) Schematic representation of the laser-induced opening of a capsule at a desired area and the release of encapsulated material in a pre-selected direction. The degradation products of the dex-HEMA/DMAEMA hydrogel onto the polyelectrolyte membrane exert an osmotic pressure against the capsule wall (orange arrows). The large size of the capsules and the presence of IR-sensitive gold nanoparticles (black dots) make it easy to open the shells at a desired site using an IR laser. Once an incision is made, the content of the capsules is released. (Reprinted from ref. with permission from The Royal Society of Chemistry). (b) Fluorescence microscopy snapshots of the site-specific opening of a giant polyelectrolyte capsule by IR laser activation. The inset shows the pore in the polyelectrolyte shell. The arrow indicates the direction of release as osmotic pressure drives encapsulated material out of the capsule. (Reprinted from ref. with permission from The Royal Society of Chemistry). (c–e) A polymeric microcapsule shell acts as a reversible nanomembrane. Upon laser light illumination one of the microcapsules (top) partially releases encapsulated polymers (c) and reseals (d). After the second illumination the microcapsule completely releases its content (e). Profiles in the left upper corner are drawn along the green line. (Reprinted with permission from ref. . Copyright (2008) by The American Chemical Society). (f, g) CLSM images taken before (f) and after (g) laser-illumination of the inner shell (orange) doped with gold particles in the course of laser stimulated mixing of both compartments (outer compartment shown in green). (Reprinted with permission from ref. . Copyright (2007) by John Wiley and Sons). (h) Fluorescence CLSM images of pericentric multicompartment structures based on the CaCO3 inner core (red) and PS nanoparticles in the outer (green). (Reprinted with permission from ref. . Copyright (2010) by John Wiley and Sons).
Fig. 13
Fig. 13
Chemical patterning with temperature and RF responsive particles. (a) Two consecutive reactions in a single large unilamellar vesicle (LUV) nanoreactor. The nanoreactor was loaded with two kinds of small unilamellar vesicles (SUVs), the first kind with a phase transition temperature Tt = 23 °C and encapsulating dichlorodimethylacridinone (DDAO) phosphate (dark red), the other with Tt = 41 °C and containing fluorescein diphosphate (FDP, dark green). (Reprinted with permission from ref. . Copyright (2008) by John Wiley and Sons). (b–d) Schematic illustration (b) and TEM images (c, d) of the controlled-release Au-nanocages-based system. (b) On exposure to a near-infrared laser, the light is absorbed by the nanocage and converted into heat, triggering the smart polymer to collapse and thus release the pre-loaded effector. When the laser is turned off, the polymer chains will relax back to the extended conformation and terminate the release. (Reprinted with permission from ref. . Copyright (2009) by The Nature Publishing Group). (c) TEM images of Au nanocages for which the surface was covered by a pNIPAAm-co-pAAm copolymer with the lower critical solution temperature at 39 °C. The inset shows a magnified TEM image of the corner of such a nanocage. (Reprinted with permission from ref. . Copyright (2009) by The Nature Publishing Group). (d) TEM of multiple-walled Au/Ag nanoshells. (Reprinted with permission from ref. . Copyright (2004) by The American Chemical Society). (e–g) Optical images showing the remote controlled, spatially localized microfabrication within a capillary. Two microwires (1 and 2) were embedded within a microfabricated capillary (ca. 1 mm in diameter and 1.5 cm in length) and the capillary was aligned on top of a 2D microcoil. The microcoil was used to remotely increase the temperature of the container. Separate containers filled with pluronic and soaked with the chemical sensitizer and activator were guided into the capillary to the site of the gap within wire 1 using a magnetic stylus (e, f). The capillary was then flushed with a commercial electroless copper-plating solution; chemical reduction (bubbles of the hydrogen gas, a byproduct in the reaction, can be seen) of copper sulfate to metallic copper, occurred at the gap within microwire 1 (g). As a result copper was deposited only in the gap within wire 1 (not shown in the figure). (Reprinted with permission from ref. . Copyright (2007) by John Wiley and Sons).
Fig. 14
Fig. 14
Antigen-responsive capsules. (a) Design of an aptamer-gated DNA nanorobot. The device transitions from its closed state to open when aptamer-based locks are displaced by binding to an antigen key. Payloads such as gold nanoparticles and antibody fragments (shown in pink) can be loaded. (b, c) TEM images of robots loaded with 5-nm gold nanoparticles in closed and open conformations. Scale bars, 20 nm. (Reprinted with permission from ref. . Copyright (2012) by The American Association for the Advancement of Science).
Fig. 15
Fig. 15
Chemistry using arrays of chemical sources. (a) An array of 106 catalyst-loaded excitable particles (brown spheres) with a spiral Belousov–Zhabotinsky wave behavior (blue spiral). (Reprinted with permission from ref. . Copyright (2009) by The American Physical Society). (b) Confocal images of RBL cells (green) on a patterned supported liquid bilayer membrane (red) showing interaction between RBL cells and the patterned lipid bilayer. (Reprinted with permission from ref. . Copyright (2003) by The American Chemical Society). (c) SEM micrograph of a platinum nanocluster array fabricated on an oxidized silicon surface by electron beam lithography. (Reprinted with permission from ref. . Copyright (1998) by The American Chemical Society). (d) CLSM imaging in situ of resorufin formation in an array of polyelectrolyte multilayer microcapsules. Fluorescence occurs in the interior of the patterned microcapsules (capsules shells did not contain fluorescently labeled polymer). (Reprinted from ref. with permission from The Royal Society of Chemistry). (e, f) Optical images of a 65 μm thick SU-8 holder with recessed slots and a 3 × 3 array of self-assembled microcontainers positioned in it. (Reprinted from ref. with permission from The Royal Society of Chemistry). (g) Optical image of an ordered 3D microcontainer array on a curved surface. (Reprinted from ref. with permission from The Royal Society of Chemistry). (g) Trajectories recorded over 2 min time interval of single λ-DNA chains undergoing Brownian motion inside micrometer-sized chambers fabricated in silicone. (Reprinted with permission from ref. . Copyright (2005) by The Nature Publishing Group). (h) Fluorescent images of enzymatic activity in micrometer-sized chambers. (Reprinted with permission from ref. . Copyright (2005) by The Nature Publishing Group).
Fig. 16
Fig. 16
Spatially controlled chemistry with droplet microfluidics. (a) A schematic of three different approaches, namely co-flow, T-junction and flow focusing, conventionally used for droplet generation. (Reprinted from ref. with permission from The Royal Society of Chemistry). (b–d) Types of droplets/particles created in microfluidic devices. The devices are capable of creating disc-shaped Janus droplets which can be polymerized with UV into Janus particles, ternary droplets as well as emulsions with a hierarchy of droplets confined within one another (i.e. multiple emulsions). (Reprinted with permission from ref. , , . Copyright (2006), (2007) by The American Chemical Society and (2006) by John Wiley and Sons). (e) Sequential fusion of droplets in a microfluidic device. The laser (at the position indicated with the white arrow) is used to position the droplets while the electrodes (the black line at the bottom of the figure shows one of the electrodes, the top electrode is not shown) are used to induce coalescence of the droplets. The Roman numerals below the figure indicate different stages of the fusion process. (Reprinted from ref. with permission from the Royal Society of Chemistry). (f) Chemical reaction product formation as a function of time for a reaction proceeding inside droplets as observed in a microfluidic device. The experimental setup allows for millisecond resolution of the reaction progress. (Reprinted with permission from ref. . Copyright (2003) by The American Chemical Society). (g) Small group of bacteria confined to a picoliter droplet. The white arrow points to one of the bacteria. (Reprinted with permission from ref. . Copyright (2009) by John Wiley and Sons). (h) An alginate bead encapsulating mammalian cells. The cells have been stained with trypan blue to differentiate the living cells from the dead ones. (Reprinted with permission from ref. . Copyright (2007) by John Wiley and Sons).
Fig. 17
Fig. 17
Chemical patterning with 2D microfluidic devices. (a) A schematic of the microfluidic network and fluorescence micrographs of a periodic overlapping sawtooth gradient of fluorescein and TMRE in ethanol. The plot below the micrograph shows the numerically calculated fluorescence intensity profile across the broad channel. (Reprinted with permission from ref. . Copyright (2001) by The American Chemical Society). (b) Experimental set-up for differential manipulation of regions of a single bovine capillary endothelial cell using multiple laminar flows. Lower panel shows a close-up of the point at which the inlet channels combine into one main channel. (Reprinted with permission from ref. . Copyright (200) by The Nature Publishing Group). (c) Fluorescence images of a single cell after treatment of its right pole with Mitotracker Green FM and its left pole with Mitotracker Red CM-H2XRos. The entire cell is treated with the DNA-binding dye Hoechst 33342. (Reprinted with permission from ref. . Copyright (2001) by The Nature Publishing Group). (d, e) Overlapping diffusive gradients. Color dyes were introduced through different access ports and their concentration was maintained with a constant flow rate. For each dye an independent gradient formed with 120° angular displacement. Overlapping the three gradients results into a blend of dye concentrations where each spatial location has different combinations of dye concentrations. Scale bar 500 μm. (Reprinted from ref. with permission from The Royal Society of Chemistry). (f) A microfluidic chemotaxis device design: details of a three channel unit. Motile cells are injected into the center channel. Dual chemical gradients (schematically illustrated with gradient-colored triangles) are generated in the center channel by pumping media containing different concentrations of chemoattractants through the two side channels. (Relevant reference: 210).
Fig. 18
Fig. 18
Chemical patterning with 3D microfluidic devices. (a) Branched microvascular network embedded in PLA substrates which incorporates a hierarchy of microchannel diameters. An aqueous solution of blue food dye was injected into the interconnected microchannel array for visualization purposes. (Reprinted with permission from ref. . Copyright (2009) by John Wiley and Sons). (b) A microfluidic network having the geometry of a basketweave. The channels were filled with an aqueous solution of fluorescein (green) or Cascade Blue (blue) and illuminated with UV light. (Reprinted with permission from ref. . Copyright (2003) by The American Chemical Society). (c, d) Cross-sectional views of cell-seeded microfluidic scaffolds. Dispersed cells are shown as double circles. Microchannels are shown as squares. The pink shading represents steady-state 3D distributions of solutes: in (c), reactive solute is delivered via the channels and is consumed by cells as it diffuses into the matrix; in (d), non-reactive solute is delivered via the two channels on the left and extracted by the channels on the right. (Reprinted with permission from ref. . Copyright (2007) by The Nature Publishing Group). (e) The gradient-generating region of a microfluidic device features a tapered microchamber to produce a nonlinear gradient. By changing the shape of the gradient-generating region it is possible to change the shape of the chemical gradient. (Reprinted with permission from ref. . Copyright (2007) by The American Chemical Society). (f) A self-assembling microfluidic device with PDMS inlets/outlets attached to a Si substrate and with PDMS channels integrated with a differentially crosslinked SU-8 film. Fluorescence images showing the flow of fluorescein (green)/rhodamine B (red) through a dual channel device. (Reprinted with permision from ref. . Copyright (2011) by The Nature Publishing Group).

References

    1. Shapiro L, McAdams HH, Losick R. Science. 2002;298:1942–1946. - PubMed
    1. Shapiro L, McAdams HH, Losick R. Science. 2009;326:1225–1228. - PMC - PubMed
    1. Shapiro L, Losick R. Cell. 2000;100:89–98. - PubMed
    1. Goley ED, Iniesta AA, Shapiro L. J Cell Sci. 2007;120:3501–3507. - PubMed
    1. Rosch J, Caparon M. Science. 2004;304:1513–1515. - PubMed

LinkOut - more resources