

doi: 10.1039/c2cc36779c.
Epub 2012 Nov 12.
Electrochemical direct detection of DNA deamination catalyzed by APOBEC3G
Affiliations
- PMID: 23145435
- PMCID: PMC3541039
- DOI: 10.1039/c2cc36779c
Item in Clipboard
Electrochemical direct detection of DNA deamination catalyzed by APOBEC3G
Chem Commun (Camb).
.
Abstract
APOBEC3G catalyzes deamination of cytosines in HIV-1 genome, and restricts the HIV-1 infection. Here, we propose a picomole-scale assay for the detection of DNA deamination catalyzed by APOBEC3G. Our results show the suitability of the developed method for a time course analysis of enzyme-catalyzed DNA modifications.
Figures
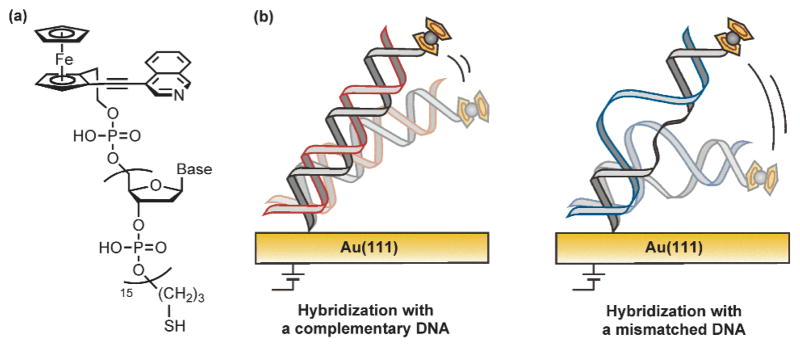
(a) The chemical structure of the ferrocene/isoquinoline conjugate-connected DNA probe. (b) Schematic representation of (left) complementary and (right) mismatched DNA hybrids on the electrode. In general, a complementary hybrid indicates a slower structural fluctuation than a mismatched hybrid.
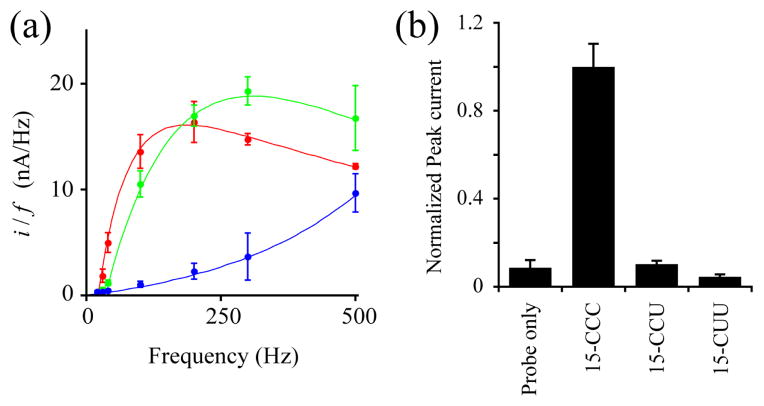
Optimization of a pulse potential frequency for the square-wave voltammetry. (a) Frequency (f) dependence of a peak current derived from a complementary, 15-CCC/Fc-GGG (red), and mismatched hybrids, 15-CCU/Fc-GGG (green) and 15-CUU/Fc-GGG (blue). (b) The normalized peak current derived from a complementary (15-CCC/Fc-GGG), mismatched hybrids (15-CCU/Fc-GGG), and probe only (Fc-GGG). The measurements were performed at 40 Hz, the optimized frequency for the probe Fc-GGG. The values denote the mean ± S.D. derived from five measurements.
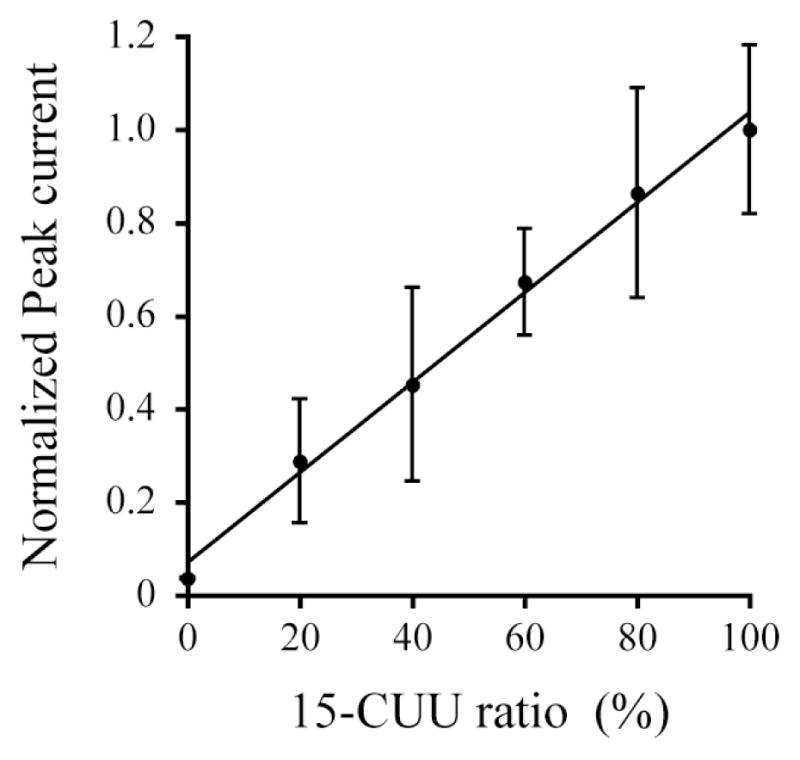
Relationship between the normalized peak current and the relative amount of target DNA. The peak current was measured using a probe DNA Fc-GAA with a mixture of 15-CCU and 15-CUU at a ratio of 100:0, 80:20, 60:40, 40:60, 20:80, and 0:100, respectively. The values denote the mean ± S.D. derived from five measurements.
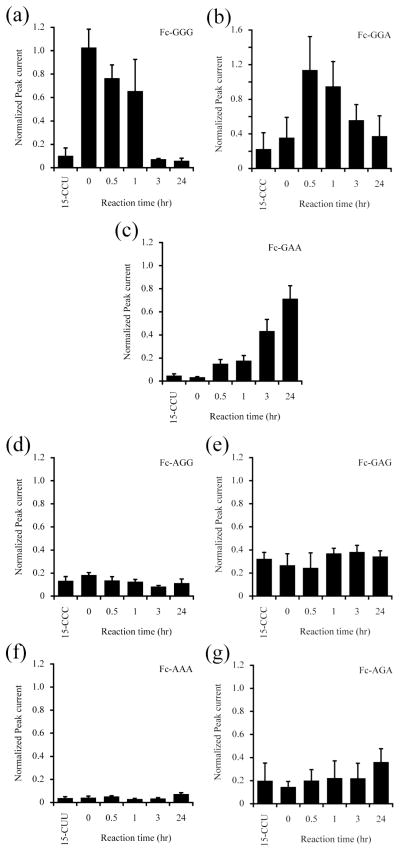
Trace of A3G-catalyzed deamination. The normalized peak current was measured with probe DNAs, (a) Fc-GGG, (b) Fc-GGA, (c) Fc-GAA, (d) Fc-AGG, (e) Fc-GAG, (f) Fc-AAA, and (g) Fc-AGA. The values denote the mean ± S.D. derived from three measurements.
Similar articles
-
APOBEC3G & HTLV-1: inhibition without deamination.Retrovirology. 2005 May 29;2:37. doi: 10.1186/1742-4690-2-37. Retrovirology. 2005. PMID: 15921532 Free PMC article.
-
Oligomerization transforms human APOBEC3G from an efficient enzyme to a slowly dissociating nucleic acid-binding protein.Nat Chem. 2014 Jan;6(1):28-33. doi: 10.1038/nchem.1795. Epub 2013 Nov 24. Nat Chem. 2014. PMID: 24345943 Free PMC article.
-
Intensity of deoxycytidine deamination of HIV-1 proviral DNA by the retroviral restriction factor APOBEC3G is mediated by the noncatalytic domain.J Biol Chem. 2011 Apr 1;286(13):11415-26. doi: 10.1074/jbc.M110.199604. Epub 2011 Feb 7. J Biol Chem. 2011. PMID: 21300806 Free PMC article.
-
[Advances in the study of molecular mechanism of APOBEC3G anti-HIV-1].Yao Xue Xue Bao. 2008 Jul;43(7):678-82. Yao Xue Xue Bao. 2008. PMID: 18819469 Review. Chinese.
-
[Recent advances in the study of mechanism of APOBEC3G against virus].Yao Xue Xue Bao. 2014 Jan;49(1):30-6. Yao Xue Xue Bao. 2014. PMID: 24783502 Review. Chinese.
Cited by
-
Mechanism for APOBEC3G catalytic exclusion of RNA and non-substrate DNA.Nucleic Acids Res. 2019 Aug 22;47(14):7676-7689. doi: 10.1093/nar/gkz550. Nucleic Acids Res. 2019. PMID: 31424549 Free PMC article.
-
Impact of H216 on the DNA binding and catalytic activities of the HIV restriction factor APOBEC3G.J Virol. 2013 Jun;87(12):7008-14. doi: 10.1128/JVI.03173-12. Epub 2013 Apr 17. J Virol. 2013. PMID: 23596292 Free PMC article.
-
Crystal structure of the catalytic domain of HIV-1 restriction factor APOBEC3G in complex with ssDNA.Nat Commun. 2018 Jun 25;9(1):2460. doi: 10.1038/s41467-018-04872-8. Nat Commun. 2018. PMID: 29941968 Free PMC article.
References
-
- Sheehy AM, Gaddis NC, Choi JD, Malim MH. Nature. 2002;418:646. - PubMed
-
- Harris RS, Bishop KN, Sheehy AM, Craig HM, Petersen-Mahrt SK, Watt IN, Neuberger MS, Malim MH. Cell. 2003;113:803. - PubMed
-
- Yu Q, König R, Pillai K, Chiles K, Kearney M, Palmer S, Richman D, Coffin JM, Landau NR. Nat Struct Mol Biol. 2004;11:435. - PubMed
-
- Jarmuz A, Chester A, Bayliss J, Gibourne J, Dunham I, Scott J, Navaratnam N. Genomics. 2002;79:285. - PubMed
Publication types
MeSH terms
Substances
Grants and funding
LinkOut - more resources
Full Text Sources
Other Literature Sources