

An active metabolite of oltipraz (M2) increases mitochondrial fuel oxidation and inhibits lipogenesis in the liver by dually activating AMPK
- PMID: 23145499
- PMCID: PMC3605873
- DOI: 10.1111/bph.12057
An active metabolite of oltipraz (M2) increases mitochondrial fuel oxidation and inhibits lipogenesis in the liver by dually activating AMPK
Abstract
Background and purpose: Oltipraz, a cancer chemopreventive agent, has an anti-steatotic effect via liver X receptor-α (LXRα) inhibition. Here we have assessed the biological activity of a major metabolite of oltipraz (M2) against liver steatosis and steatohepatitis and the underlying mechanism(s).
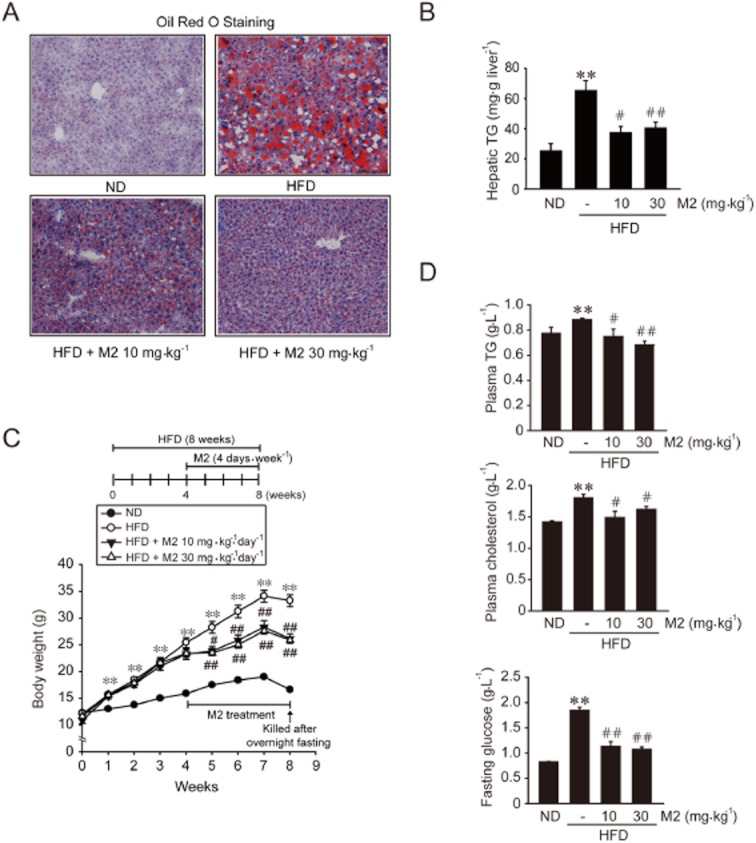
Experimental approach: Blood biochemistry and histopathology were assessed in high-fat diet (HFD)-fed mice treated with M2. An in vitroHepG2 cell model was used to study the mechanism of action. Immunoblotting, real-time PCR and luciferase reporter assays were performed to measure target protein or gene expression levels.
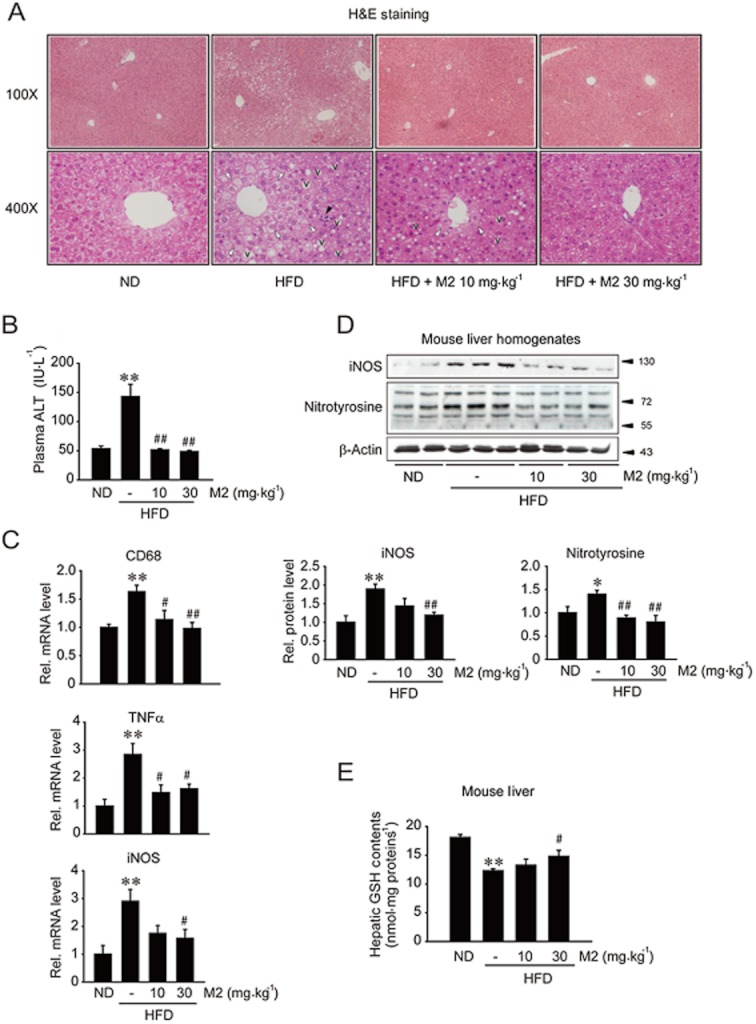
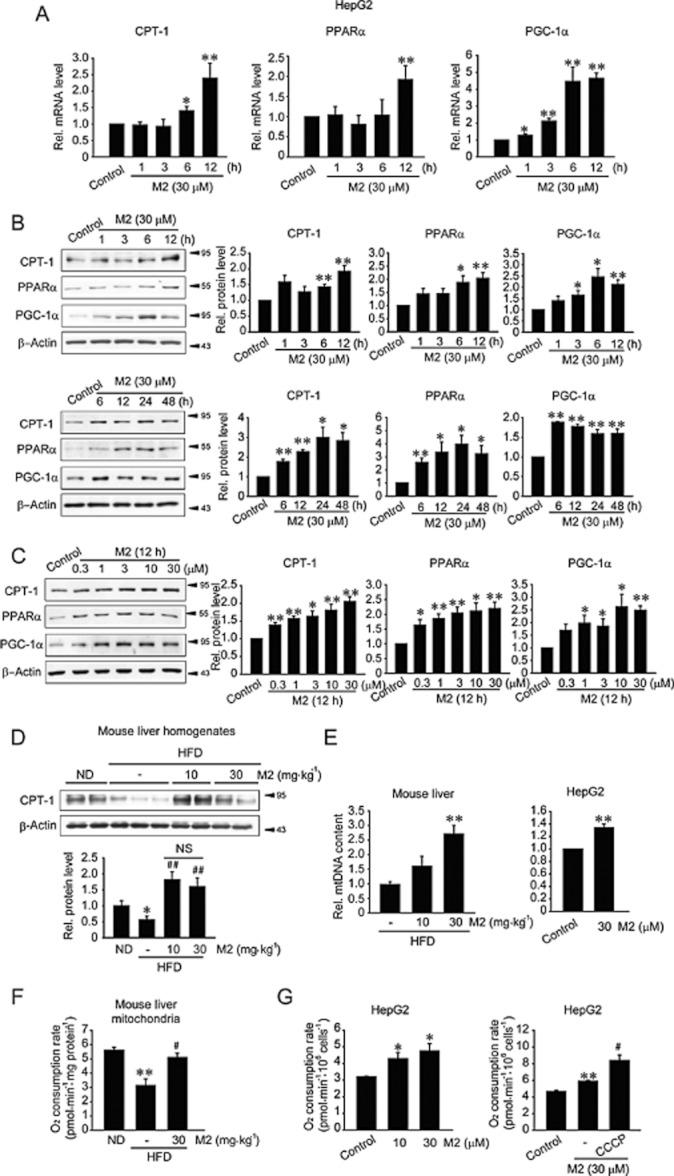
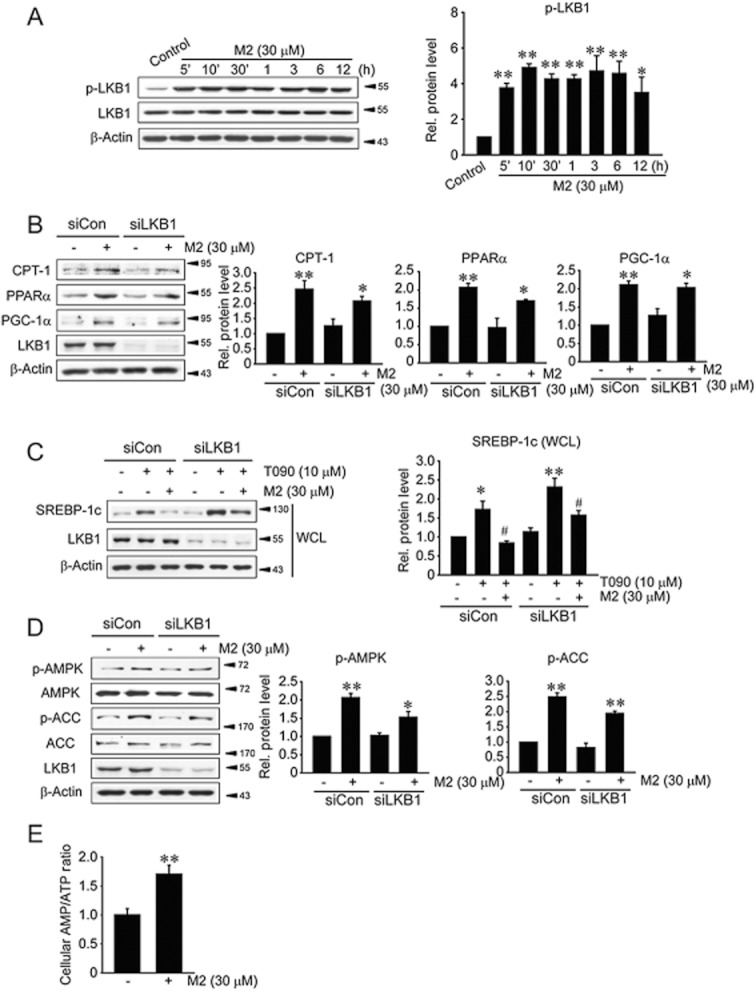
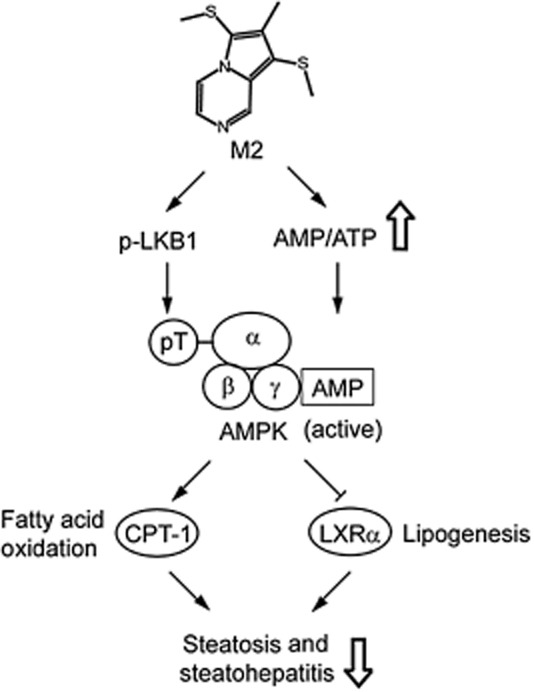
Key results: M2 treatment inhibited HFD-induced steatohepatitis and diminished oxidative stress in liver. It increased expression of genes encoding proteins involved in mitochondrial fuel oxidation. Mitochondrial DNA content and oxygen consumption rate were enhanced. Moreover, M2 treatment repressed activity of LXRα and induction of its target genes, indicating anti-lipogenic effects. M2 activated AMP-activated protein kinase (AMPK). Inhibition of AMPK by over-expression of dominant negative AMPK (DN-AMPK) or by Compound C prevented M2 from inducing genes for fatty acid oxidation and repressed sterol regulatory element binding protein-1c (SREBP-1c) expression. M2 activated liver kinase B1 (LKB1) and increased the AMP/ATP ratio. LKB1 knockdown failed to reverse target protein modulations or AMPK activation by M2, supporting the proposal that both LKB1 and increased AMP/ATP ratio contribute to its anti-steatotic effect.
Conclusion and implications: M2 inhibited liver steatosis and steatohepatitis by enhancing mitochondrial fuel oxidation and inhibiting lipogenesis. These effects reflected activation of AMPK elicited by increases in LKB1 activity and AMP/ATP ratio.
© 2012 The Authors. British Journal of Pharmacology © 2012 The British Pharmacological Society.
Figures


Similar articles
-
Resveratrol inhibits LXRα-dependent hepatic lipogenesis through novel antioxidant Sestrin2 gene induction.Toxicol Appl Pharmacol. 2013 Aug 15;271(1):95-105. doi: 10.1016/j.taap.2013.04.023. Epub 2013 May 5. Toxicol Appl Pharmacol. 2013. PMID: 23651738
-
Role of adenosine monophosphate-activated protein kinase-p70 ribosomal S6 kinase-1 pathway in repression of liver X receptor-alpha-dependent lipogenic gene induction and hepatic steatosis by a novel class of dithiolethiones.Hepatology. 2009 Jun;49(6):1913-25. doi: 10.1002/hep.22887. Hepatology. 2009. PMID: 19378344
-
Oxyresveratrol ameliorates nonalcoholic fatty liver disease by regulating hepatic lipogenesis and fatty acid oxidation through liver kinase B1 and AMP-activated protein kinase.Chem Biol Interact. 2018 Jun 1;289:68-74. doi: 10.1016/j.cbi.2018.04.023. Epub 2018 Apr 24. Chem Biol Interact. 2018. PMID: 29702089
-
Natural compounds against nonalcoholic fatty liver disease: A review on the involvement of the LKB1/AMPK signaling pathway.Phytother Res. 2023 Dec;37(12):5769-5786. doi: 10.1002/ptr.8020. Epub 2023 Sep 25. Phytother Res. 2023. PMID: 37748097 Review.
-
The role of liver kinase B1 in tumor progression through regulation of lipid metabolism.Clin Transl Oncol. 2022 Nov;24(11):2045-2054. doi: 10.1007/s12094-022-02863-2. Epub 2022 Jul 27. Clin Transl Oncol. 2022. PMID: 35896782 Free PMC article. Review.
Cited by
-
Druggability of lipid metabolism modulation against renal fibrosis.Acta Pharmacol Sin. 2022 Mar;43(3):505-519. doi: 10.1038/s41401-021-00660-1. Epub 2021 May 14. Acta Pharmacol Sin. 2022. PMID: 33990764 Free PMC article. Review.
-
Induction of the hepatic aryl hydrocarbon receptor by alcohol dysregulates autophagy and phospholipid metabolism via PPP2R2D.Nat Commun. 2022 Oct 14;13(1):6080. doi: 10.1038/s41467-022-33749-0. Nat Commun. 2022. PMID: 36241614 Free PMC article.
-
The role of the Nrf2/Keap1 pathway in obesity and metabolic syndrome.Rev Endocr Metab Disord. 2015 Mar;16(1):35-45. doi: 10.1007/s11154-014-9305-9. Rev Endocr Metab Disord. 2015. PMID: 25540093 Review.
-
Gα12 ablation exacerbates liver steatosis and obesity by suppressing USP22/SIRT1-regulated mitochondrial respiration.J Clin Invest. 2018 Dec 3;128(12):5587-5602. doi: 10.1172/JCI97831. Epub 2018 Nov 12. J Clin Invest. 2018. PMID: 30300140 Free PMC article.
References
-
- Aharoni-Simon M, Hann-Obercyger M, Pen S, Madar Z, Tirosh O. Fatty liver is associated with impaired activity of PPARγ-coactivator 1α (PGC-1α) and mitochondrial biogenesis in mice. Lab Invest. 2011;91:1018–1028. - PubMed
-
- Aquilano K, Vigilanza P, Baldelli S, Pagliei B, Rotilio G, Ciriolo MR. Peroxisome proliferator-activated receptor gamma co-activator 1alpha (PGC-1alpha) and sirtuin 1 (SIRT1) reside in mitochondria: possible direct function in mitochondrial biogenesis. J Biol Chem. 2010;285:21590–21599. - PMC - PubMed
-
- Arany Z, He H, Lin J, Hoyer K, Handschin C, Toka O, et al. Transcriptional coactivator PGC-1 alpha controls the energy state and contractile function of cardiac muscle. Cell Metab. 2005;1:259–271. - PubMed
-
- Bae EJ, Yang YM, Kim JW, Kim SG. Identification of a novel class of dithiolethiones that prevent hepatic insulin resistance via the adenosine monophosphate-activated protein kinase-p70 ribosomal S6 kinase-1 pathway. Hepatology. 2007;46:730–739. - PubMed
-
- Bae SK, Kim EJ, Chung SJ, Kim SG, Lee MG. Pharmacokinetic interaction between oltipraz and dimethyl-4,4′-dimethoxy-5,6,5′,6′-dimethylene dioxybiphenyl-2,2′-dicarboxylate (DDB) after single intravenous and oral administration to rats. J Pharm Pharmacol. 2003;55:1241–1249. - PubMed
Publication types
MeSH terms
Substances
LinkOut - more resources
Full Text Sources
Other Literature Sources
Medical
Molecular Biology Databases
