

Analysis of the cochlear microphonic to a low-frequency tone embedded in filtered noise
- PMID: 23145616
- PMCID: PMC3505208
- DOI: 10.1121/1.4757746
Analysis of the cochlear microphonic to a low-frequency tone embedded in filtered noise
Abstract
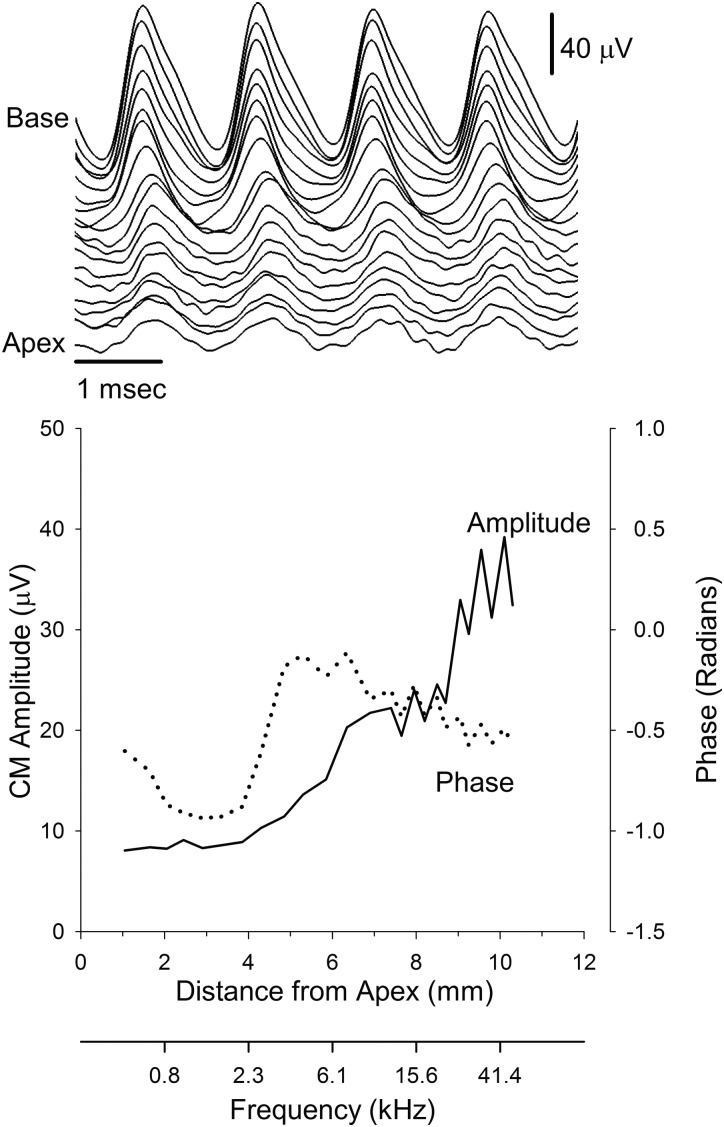
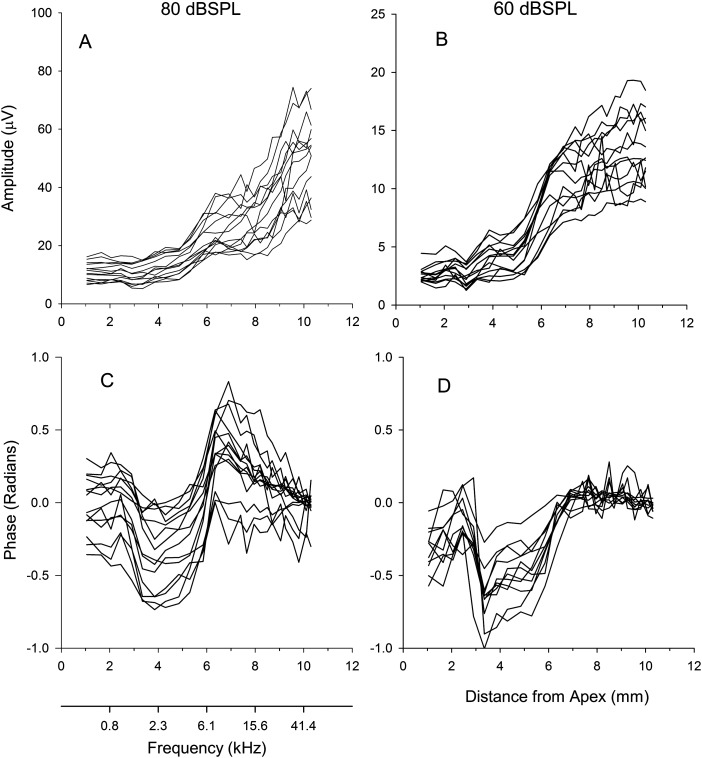
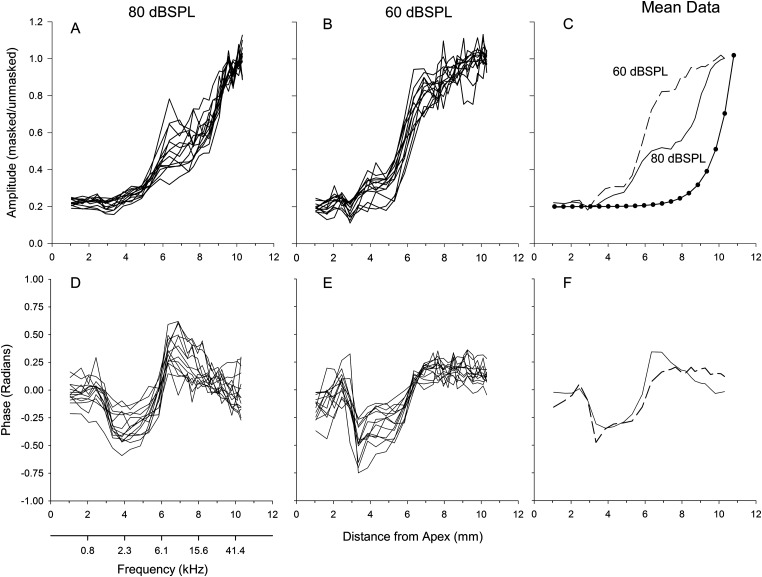
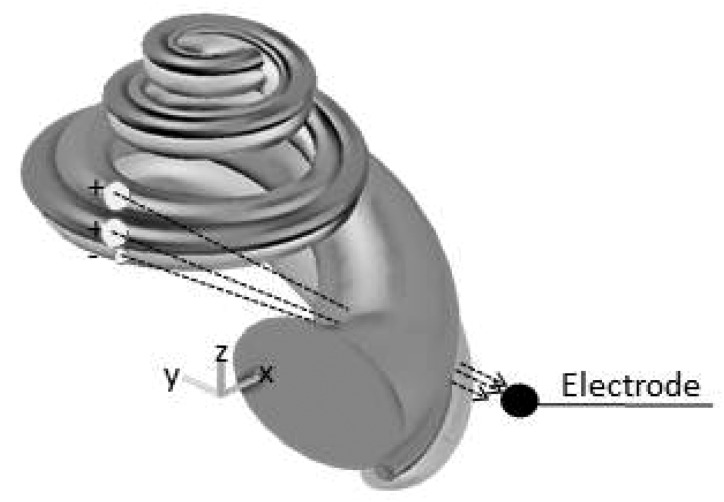
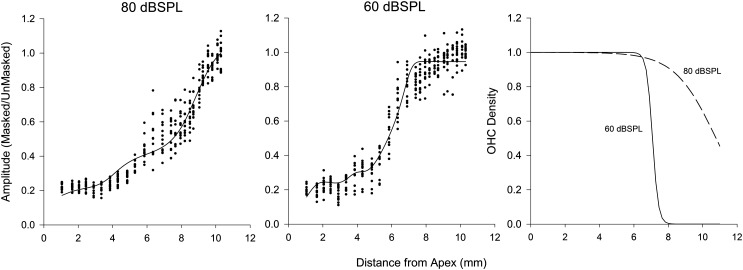
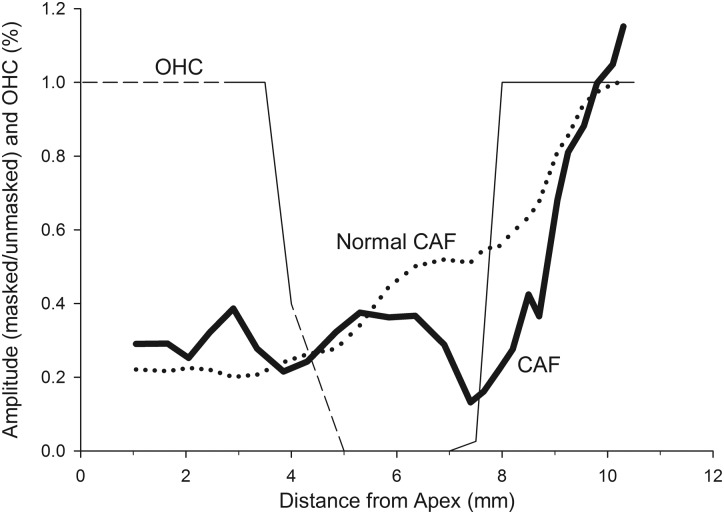
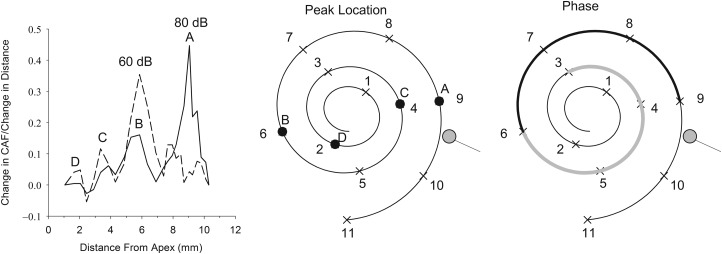
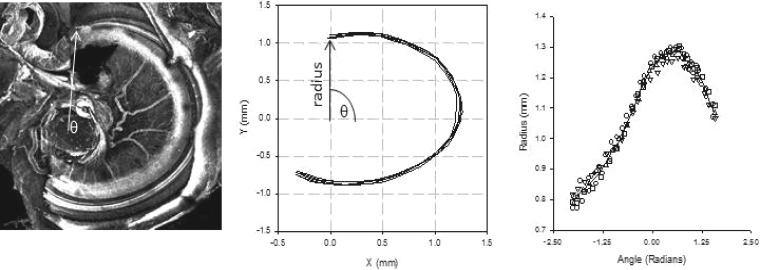
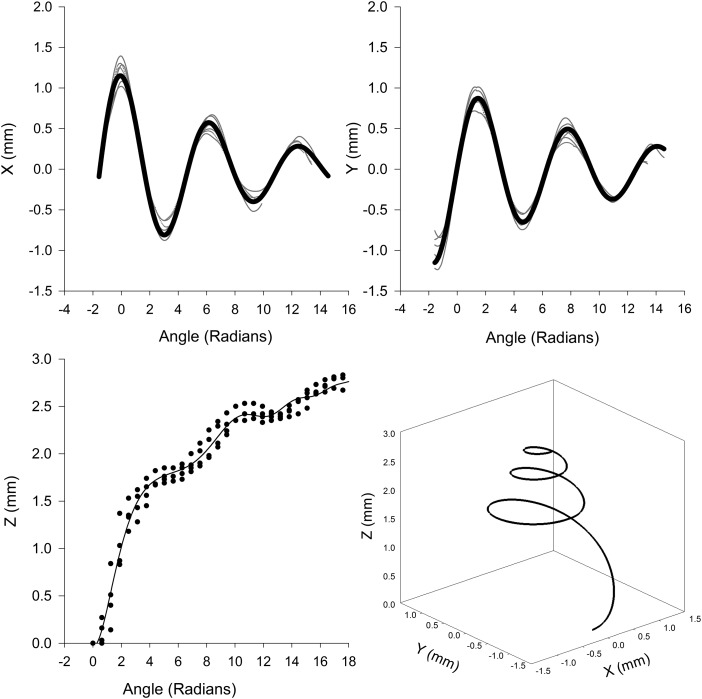
The cochlear microphonic was recorded in response to a 733 Hz tone embedded in noise that was high-pass filtered at 25 different frequencies. The amplitude of the cochlear microphonic increased as the high-pass cutoff frequency of the noise increased. The amplitude growth for a 60 dB SPL tone was steeper and saturated sooner than that of an 80 dB SPL tone. The growth for both signal levels, however, was not entirely cumulative with plateaus occurring at about 4 and 7 mm from the apex. A phenomenological model of the electrical potential in the cochlea that included a hair cell probability function and spiral geometry of the cochlea could account for both the slope of the growth functions and the plateau regions. This suggests that with high-pass-filtered noise, the cochlear microphonic recorded at the round window comes from the electric field generated at the source directed towards the electrode and not down the longitudinal axis of the cochlea.
Figures
Similar articles
-
Constructing a cochlear transducer function from the summating potential using a low-frequency bias tone.J Acoust Soc Am. 2004 Nov;116(5):2996-3007. doi: 10.1121/1.1791722. J Acoust Soc Am. 2004. PMID: 15603145
-
The origin of the low-frequency microphonic in the first cochlear turn of guinea-pig.Hear Res. 1989 May;39(1-2):177-88. doi: 10.1016/0378-5955(89)90089-0. Hear Res. 1989. PMID: 2737964
-
Predicting the location of missing outer hair cells using the electrical signal recorded at the round window.J Acoust Soc Am. 2014 Sep;136(3):1212. doi: 10.1121/1.4890641. J Acoust Soc Am. 2014. PMID: 25190395 Free PMC article.
-
Relation of receptor potentials of cochlear hair cells to spike discharges of cochlear neurons.Annu Rev Physiol. 1984;46:247-59. doi: 10.1146/annurev.ph.46.030184.001335. Annu Rev Physiol. 1984. PMID: 6370108 Review. No abstract available.
-
Hearing: travelling wave or resonance?PLoS Biol. 2004 Oct;2(10):e337. doi: 10.1371/journal.pbio.0020337. Epub 2004 Oct 12. PLoS Biol. 2004. PMID: 15486577 Free PMC article. Review.
Cited by
-
Minimum Detectable Differences in Electrocochleography Measurements: Bayesian-Based Predictions.J Assoc Res Otolaryngol. 2023 Apr;24(2):217-237. doi: 10.1007/s10162-023-00888-0. Epub 2023 Feb 16. J Assoc Res Otolaryngol. 2023. PMID: 36795197 Free PMC article.
-
Computational modeling of the human compound action potential.J Acoust Soc Am. 2023 Apr 1;153(4):2376. doi: 10.1121/10.0017863. J Acoust Soc Am. 2023. PMID: 37092943 Free PMC article.
-
Distinguishing hair cell from neural potentials recorded at the round window.J Neurophysiol. 2014 Feb;111(3):580-93. doi: 10.1152/jn.00446.2013. Epub 2013 Oct 16. J Neurophysiol. 2014. PMID: 24133227 Free PMC article.
-
Using Cochlear Microphonic Potentials to Localize Peripheral Hearing Loss.Front Neurosci. 2017 Apr 4;11:169. doi: 10.3389/fnins.2017.00169. eCollection 2017. Front Neurosci. 2017. PMID: 28420953 Free PMC article.
-
The potential use of low-frequency tones to locate regions of outer hair cell loss.Hear Res. 2016 Dec;342:39-47. doi: 10.1016/j.heares.2016.09.006. Epub 2016 Sep 24. Hear Res. 2016. PMID: 27677389 Free PMC article.
References
-
- Békésy, G. v. (1951). “The course of the electrical resistance in the cochlea of the guinea pig (electroanatomy of the cochlea),” J. Acoust. Soc. Am. 23, 18–28.10.1121/1.1906721 - DOI
Publication types
MeSH terms
Grants and funding
LinkOut - more resources
Full Text Sources
Other Literature Sources
Medical
Miscellaneous