

Measuring decision weights in recognition experiments with multiple response alternatives: comparing the correlation and multinomial-logistic-regression methods
- PMID: 23145622
- PMCID: PMC3505214
- DOI: 10.1121/1.4754523
Measuring decision weights in recognition experiments with multiple response alternatives: comparing the correlation and multinomial-logistic-regression methods
Abstract
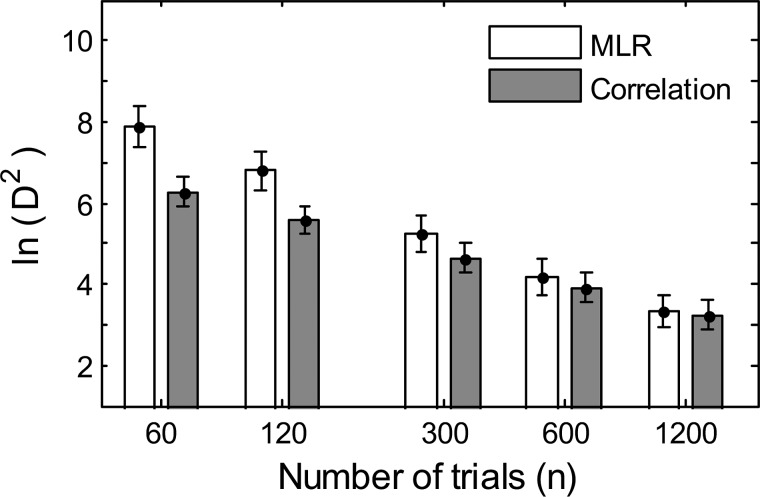
Psychophysical "reverse-correlation" methods allow researchers to gain insight into the perceptual representations and decision weighting strategies of individual subjects in perceptual tasks. Although these methods have gained momentum, until recently their development was limited to experiments involving only two response categories. Recently, two approaches for estimating decision weights in m-alternative experiments have been put forward. One approach extends the two-category correlation method to m > 2 alternatives; the second uses multinomial logistic regression (MLR). In this article, the relative merits of the two methods are discussed, and the issues of convergence and statistical efficiency of the methods are evaluated quantitatively using Monte Carlo simulations. The results indicate that, for a range of values of the number of trials, the estimated weighting patterns are closer to their asymptotic values for the correlation method than for the MLR method. Moreover, for the MLR method, weight estimates for different stimulus components can exhibit strong correlations, making the analysis and interpretation of measured weighting patterns less straightforward than for the correlation method. These and other advantages of the correlation method, which include computational simplicity and a close relationship to other well-established psychophysical reverse-correlation methods, make it an attractive tool to uncover decision strategies in m-alternative experiments.
Figures


Similar articles
-
Psychophysical reverse correlation with multiple response alternatives.J Exp Psychol Hum Percept Perform. 2010 Aug;36(4):976-93. doi: 10.1037/a0017171. J Exp Psychol Hum Percept Perform. 2010. PMID: 20695712 Free PMC article.
-
Strategic and Dynamic Temporal Weighting for Perceptual Decisions in Humans and Macaques.eNeuro. 2018 Oct 15;5(5):ENEURO.0169-18.2018. doi: 10.1523/ENEURO.0169-18.2018. eCollection 2018 Sep-Oct. eNeuro. 2018. PMID: 30406190 Free PMC article.
-
Adaptive stimulus selection for multi-alternative psychometric functions with lapses.J Vis. 2018 Nov 1;18(12):4. doi: 10.1167/18.12.4. J Vis. 2018. PMID: 30458512 Free PMC article.
-
Confirmation Bias through Selective Overweighting of Choice-Consistent Evidence.Curr Biol. 2018 Oct 8;28(19):3128-3135.e8. doi: 10.1016/j.cub.2018.07.052. Epub 2018 Sep 13. Curr Biol. 2018. PMID: 30220502
-
Designing and Interpreting Psychophysical Investigations of Cognition.Neuron. 2019 Oct 9;104(1):100-112. doi: 10.1016/j.neuron.2019.09.016. Neuron. 2019. PMID: 31600507 Free PMC article. Review.
References
-
- Ahumada, A. J. J. (1996). “ Perceptual classification images from vernier acuity masked by noise,” Perception 25, 18.
-
- Ahumada, A. J. J., and Beard, B. L. (1998). “ Response classification images in vernier acuity,” Invest. Opthalmol. Visual Sci. 40, S572.
Publication types
MeSH terms
Grants and funding
LinkOut - more resources
Full Text Sources