

The conserved oligomeric Golgi complex is involved in penetration resistance of barley to the barley powdery mildew fungus
- PMID: 23145810
- PMCID: PMC6638642
- DOI: 10.1111/j.1364-3703.2012.00846.x
The conserved oligomeric Golgi complex is involved in penetration resistance of barley to the barley powdery mildew fungus
Abstract
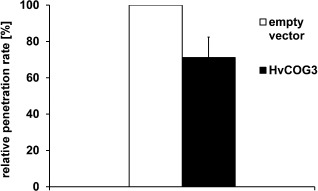
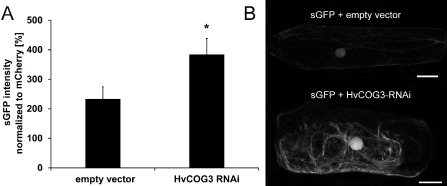
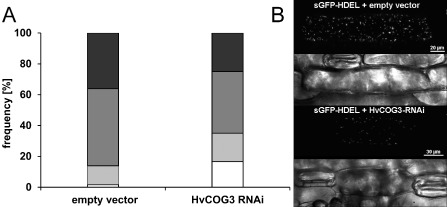
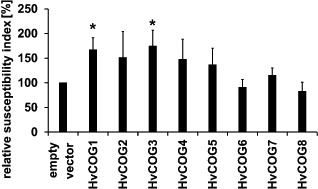
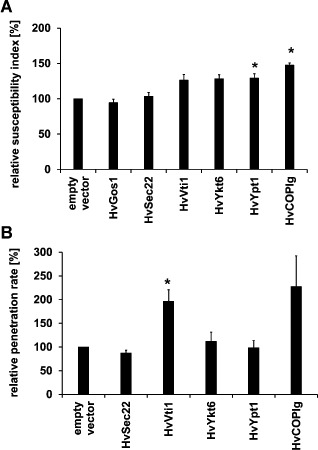
Membrane trafficking is vital to plant development and adaptation to the environment. It is suggested that post-Golgi vesicles and multivesicular bodies are essential for plant defence against directly penetrating fungal parasites at the cell wall. However, the actual plant proteins involved in membrane transport for defence are largely unidentified. We applied a candidate gene approach and single cell transient-induced gene silencing for the identification of membrane trafficking proteins of barley involved in the response to the fungal pathogen Blumeria graminis f.sp. hordei. This revealed potential components of vesicle tethering complexes [putative exocyst subunit HvEXO70F-like and subunits of the conserved oligomeric Golgi (COG) complex] and Golgi membrane trafficking (COPIγ coatomer and HvYPT1-like RAB GTPase) as essential for resistance to fungal penetration into the host cell.
© 2012 THE AUTHORS. MOLECULAR PLANT PATHOLOGY © 2012 BSPP AND BLACKWELL PUBLISHING LTD.
Figures
Similar articles
-
Interaction of a Blumeria graminis f. sp. hordei effector candidate with a barley ARF-GAP suggests that host vesicle trafficking is a fungal pathogenicity target.Mol Plant Pathol. 2014 Aug;15(6):535-49. doi: 10.1111/mpp.12110. Epub 2014 Mar 3. Mol Plant Pathol. 2014. PMID: 24304971 Free PMC article.
-
Multivesicular compartments proliferate in susceptible and resistant MLA12-barley leaves in response to infection by the biotrophic powdery mildew fungus.New Phytol. 2006;172(3):563-76. doi: 10.1111/j.1469-8137.2006.01844.x. New Phytol. 2006. PMID: 17083686
-
A powdery mildew core effector protein targets the host endosome tethering complexes HOPS and CORVET in barley.Plant Physiol. 2025 Mar 28;197(4):kiaf067. doi: 10.1093/plphys/kiaf067. Plant Physiol. 2025. PMID: 39973312 Free PMC article.
-
Specific Resistance of Barley to Powdery Mildew, Its Use and Beyond. A Concise Critical Review.Genes (Basel). 2020 Aug 21;11(9):971. doi: 10.3390/genes11090971. Genes (Basel). 2020. PMID: 32825722 Free PMC article. Review.
-
Magical mystery tour: MLO proteins in plant immunity and beyond.New Phytol. 2014 Oct;204(2):273-81. doi: 10.1111/nph.12889. New Phytol. 2014. PMID: 25453131 Review.
Cited by
-
Plant Cells under Attack: Unconventional Endomembrane Trafficking during Plant Defense.Plants (Basel). 2020 Mar 21;9(3):389. doi: 10.3390/plants9030389. Plants (Basel). 2020. PMID: 32245198 Free PMC article. Review.
-
Molecular Mechanism of Autophagy: Its Role in the Therapy of Alzheimer's Disease.Curr Neuropharmacol. 2020;18(8):720-739. doi: 10.2174/1570159X18666200114163636. Curr Neuropharmacol. 2020. PMID: 31934838 Free PMC article. Review.
-
RIN4 recruits the exocyst subunit EXO70B1 to the plasma membrane.J Exp Bot. 2017 Jun 1;68(12):3253-3265. doi: 10.1093/jxb/erx007. J Exp Bot. 2017. PMID: 28338727 Free PMC article.
-
Xyloglucan endotransglycosylase/hydrolase increases tightly-bound xyloglucan and chain number but decreases chain length contributing to the defense response that Glycine max has to Heterodera glycines.PLoS One. 2021 Jan 14;16(1):e0244305. doi: 10.1371/journal.pone.0244305. eCollection 2021. PLoS One. 2021. PMID: 33444331 Free PMC article.
-
A component of the Sec61 ER protein transporting pore is required for plant susceptibility to powdery mildew.Front Plant Sci. 2013 May 16;4:127. doi: 10.3389/fpls.2013.00127. eCollection 2013. Front Plant Sci. 2013. PMID: 23720664 Free PMC article.
References
-
- An, Q. , Ehlers, K. , van Kogel, K.‐H., Bel, A.J.E. and Hückelhoven, R. (2006a) Multivesicular compartments proliferate in susceptible and resistant MLA12‐barley leaves in response to infection by the biotrophic powdery mildew fungus. New Phytol. 172, 563–576. - PubMed
-
- An, Q. , Hückelhoven, R. , van Kogel, K.‐H. and Bel, A.J.E. (2006b) Multivesicular bodies participate in a cell wall‐associated defence response in barley leaves attacked by the pathogenic powdery mildew fungus. Cell. Microbiol. 8, 1009–1019. - PubMed
-
- Assaad, F.F. , Qiu, J.L. , Youngs, H. , Ehrhardt, D. , Zimmerli, L. , Kalde, M. , Wanner, G. , Peck, S.C. , Edwards, H. , Ramonell, K. , Somerville, C.R. and Thordal‐Christensen, H. (2004) The PEN1 syntaxin defines a novel cellular compartment upon fungal attack and is required for the timely assembly of papillae. Mol. Biol. Cell 15, 5118–5129. - PMC - PubMed
-
- Bartetzko, V. , Sonnewald, S. , Vogel, F. , Hartner, K. , Stadler, R. , Hammes, U.Z. and Börnke, F. (2009) The Xanthomonas campestris pv. vesicatoria type III effector protein XopJ inhibits protein secretion: evidence for interference with cell wall‐associated defense responses. Mol. Plant–Microbe Interact. 22, 655–664. - PubMed
Publication types
MeSH terms
LinkOut - more resources
Full Text Sources
