. 2012 Nov 12;10(1):23.
doi: 10.1186/1477-9560-10-23.

Diastolic timed Vibro-Percussion at 50 Hz delivered across a chest wall sized meat barrier enhances clot dissolution and remotely administered Streptokinase effectiveness in an in-vitro model of acute coronary thrombosis

Affiliations

Diastolic timed Vibro-Percussion at 50 Hz delivered across a chest wall sized meat barrier enhances clot dissolution and remotely administered Streptokinase effectiveness in an in-vitro model of acute coronary thrombosis

Andrew Hoffmann et al. Thromb J. .

Abstract

Background: Low Frequency Vibro-Percussion (LFVP) assists clearance of thrombi in catheter systems and when applied to the heart and timed to diastole is known to enhance coronary flow. However LFVP on a clotted coronary like vessel given engagement over a chest wall sized barrier (to resemble non-invasive heart attack therapy) requires study.

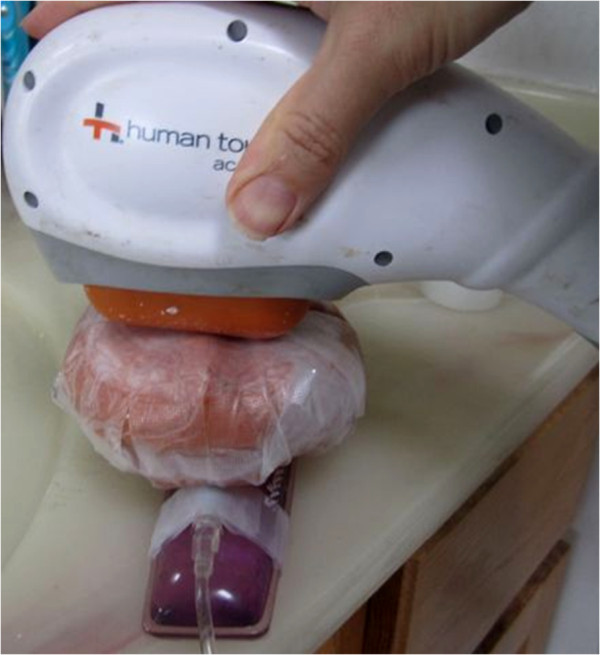
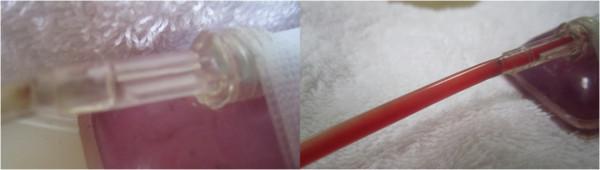
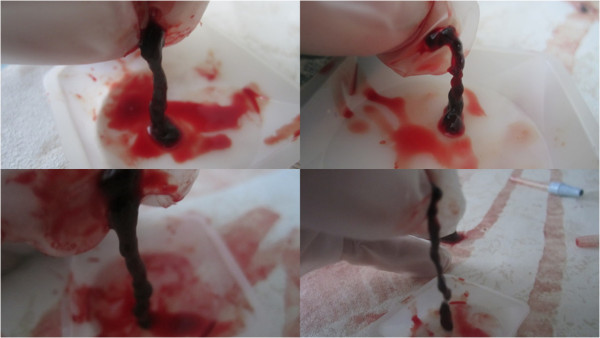
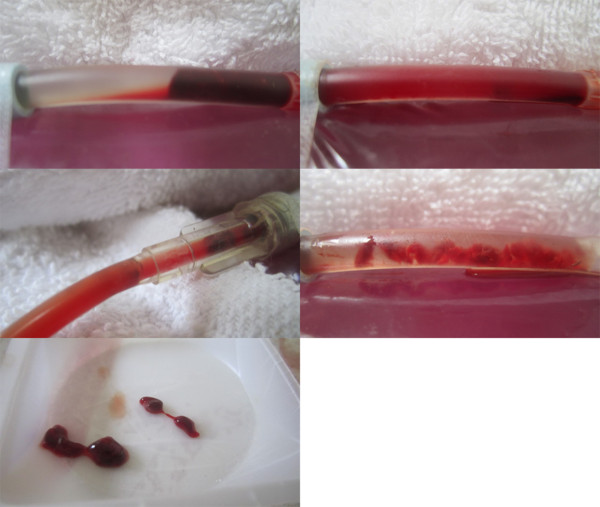
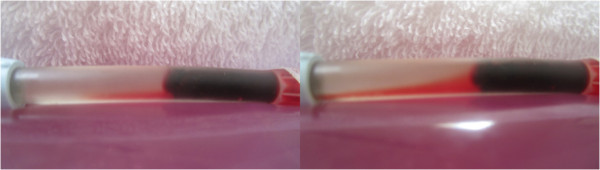
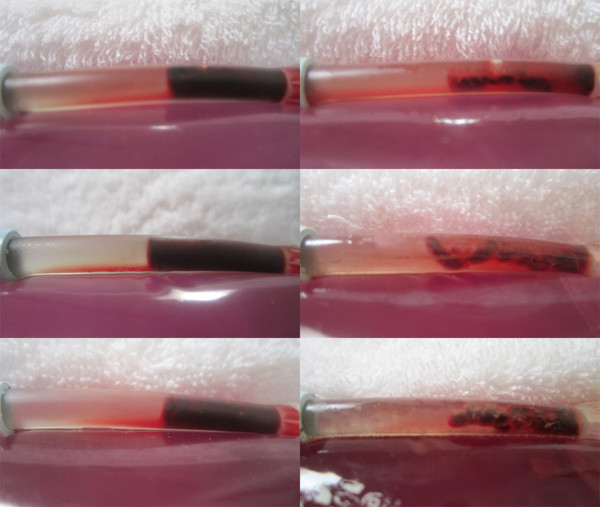
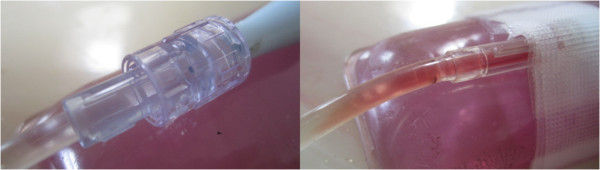
Methods: One hour old clots (n=16) were dispensed within a flexible segment of Soft-Flo catheter (4 mm lumen), weighted, interfaced with Heparinized Saline (HS), secured atop a curved dampening base, and photographed. A ~4 cm meat slab was placed over the segment and randomized to receive intermittent LFVP (engaged, - disengaged at 1 second intervals), or no LFVP for 20 minutes. HS was pulsed (~120/80 mmHg), with the diastolic phase coordinated to match LFVP delivery. The segment was then re-photographed and aspirated of fluid to determine post clot weight. The trial was then repeated with 0.5 mls of Streptokinase (15,000 IU/100 microlitre) delivered ~ 2 cm upstream from the clot.

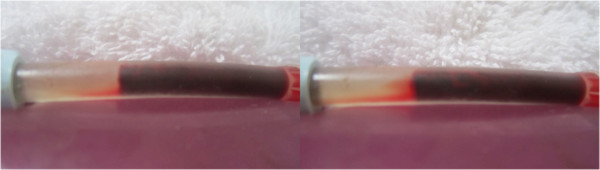
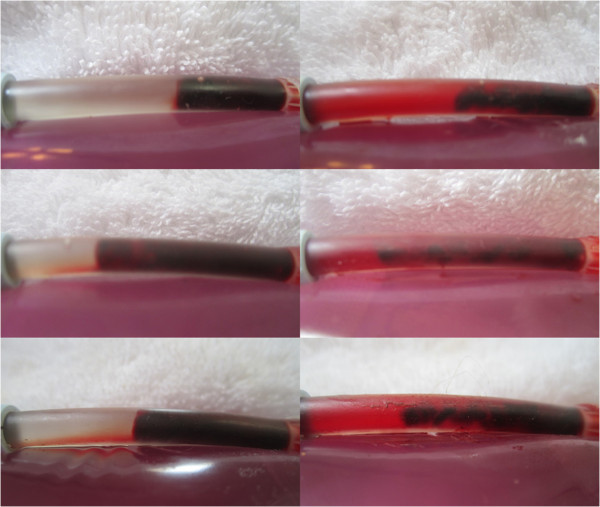
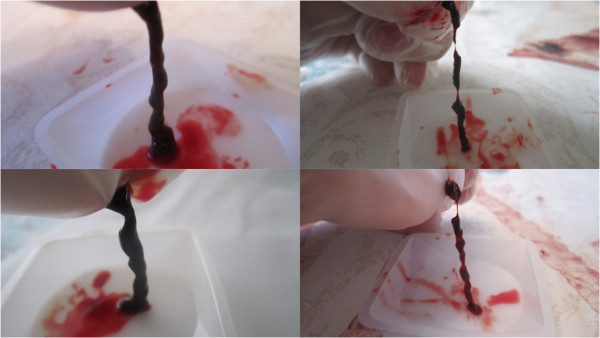
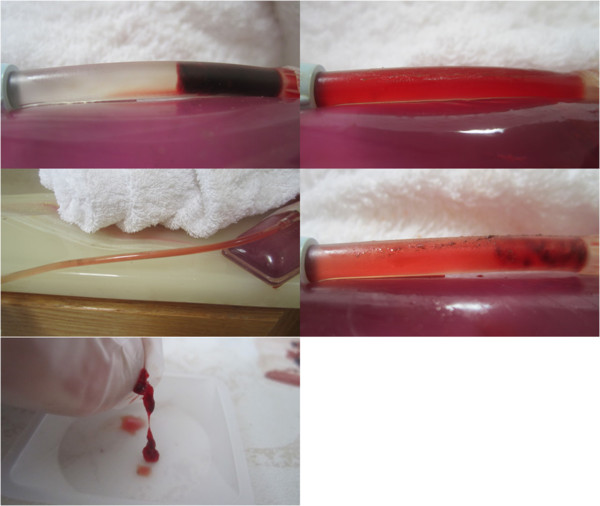
Results: LFVP - HS only samples (vs. controls) showed; a) development of clot length fluid channels absent in the control group (p < 0.0002); b) enhanced dissolved clot mixing scores ( 5.0 vs. 0.8, p < 2.8 E - 6); and c) increased percent clot dissolution (23.0% vs. 1.8% respectively, p < 8.5 E-6). LFVP - SK samples had a similar comparative clot disruptive profile, however fluid channels developed faster and percent clot dissolution more than doubled (51.0% vs. 3.0%, p< 9.8 E- 6).

Conclusion: Diastolic timed LFVP (50 Hz) engaged across a chest wall sized barrier enhances clot disruptive effects to an underlying coronary like system.


Figures

Figure 1
Figure 1
Our vibration set up. A 50 Hz massager was intermittently engaged upon a 4 cm thick meat slab overlying our clotted catheter segment. Visible is the pressurized connecting line protruding from underneath the slab. Not seen (under the slab) is the capped, 4 mm lumen Soft Flo Catheter segment with indwelling clot. To view the application in real time, please refer to the following internet link: http://www.youtube.com/watch?v=6CIcDttuERA.
Figure 2
Figure 2
Pre and post control sample (HS only group). Image (left) depicts the pre-condition of a typical control sample (from sample no. 9). Image (right) depicts the sample following 20 minutes of pulsated HS only, showing only minor changes.
Figure 3
Figure 3
Pre and post LFVP treated samples (HS only group). Images (left) depict the pre-condition of three typical LFVP samples (top to bottom, from sample no.’s 6, 10 and 16 respectively). Images (right) depict the samples following 20 minutes of pulsated HS coordinated with “diastolic” timed LFVP. Note the development of clot length fluid channels and extensive mixing of red colored dissolved clot constituents within the catheter segment.
Figure 4
Figure 4
Post treatment clot constituent mixing (Control vs. LFVP sample). Image (left) shows the typical (and absent) degree of post treatment dissolved clot constituent mixing into the connecting line of a control sample (from sample no. 9). Control samples never at any time showed any permeation of red color into the connecting line. Image (right) shows the comparatively pronounced degree of mixing commonly observed in a LFVP sample (image taken from sample no. 10).
Figure 5
Figure 5
Post treatment clot morphology (Control vs. LFVP samples). Images (left) show the post condition of a pair of control clots following treatment (top to bottom from sample no. 11 and 9 respectively). Images (right) show the post condition of a pair of LFVP treated clots (top to bottom from sample no. 16 and 10 respectively). Note the smooth surface of the control clots in comparison to the more jagged, eroded appearance of the vibrated clots.
Figure 6
Figure 6
Images from LFVP sample no. 8 which led to clot fragmentation. Image (upper left) depicts the clot’s pre-condition (mixing score graded 0). Image (upper right) depicts the catheter segment following 20 minutes of “diastolic” timed LFVP (in this sample the clot migrated proximally from the catheter’s distal cap). Image (middle left) shows dissolved clot constituent mixing, including part of the clot, which had migrated up the connecting line (mixing score graded 5, Relative Mixing Score therefore +5). Image (middle right) shows the clot after being flowed back to its original position. Image (bottom) shows a sample of the expired clot which had fragmented.
Figure 7
Figure 7
Pre and post control sample (SK enriched group). Image (left) depicts the pre-condition of a typical SK enriched control sample (from sample no. 1). Image (right) depicts the sample following 20 minutes of pulsated fluid only showing only minor changes.
Figure 8
Figure 8
Pre and post LFVP treated samples (SK enriched group). Images (left) depict the pre-condition of three SK enriched LFVP samples (images, top to bottom taken from sample no.’s 6, 11 and 15 respectively). Images (right) depict the samples following 20 minutes of pulsated fluid coordinated with “diastolic” timed LFVP. Note the obvious decrease in clot size and development of substantial clot length fluid channels within the catheter segment.
Figure 9
Figure 9
Post SK treated clot constituent mixing (Control vs. LFVP sample). Image (left) shows the typical (and again absent) degree of post treatment dissolved clot constituent mixing into the connecting line in a SK enriched control sample (from sample no. 1). Image (right) shows the comparatively pronounced mixing observed during an SK enriched LFVP application (from sample no. 15). Note the relative faintness of red color in the LFVP SK treated sample which we attributed to a lytic induced dissipation effect.
Figure 10
Figure 10
Post SK treated clot morphology (Control vs. LFVP samples). Images (left) show the post condition of a pair of SK enriched control clots following 20 minutes of pulsated fluid only (top to bottom from sample no. 4 and 1 respectively). Images (right) show the post condition of a pair of SK enriched LFVP treated clots (top to bottom from sample no. 7 and 11 respectively). Note the relatively smooth surface of the control clots in comparison to the much more eroded appearance of the vibrated clots which are held intact by tiny strands.
Figure 11
Figure 11
Images of SK enriched LFVP treated sample no. 9 yielding clot mobilization. Image (upper left) depicts the clot’s pre-condition with SK administered 2.5 cm from the clot interface (mixing score graded 0). Image (upper right) depicts the catheter segment following 20 minutes of “diastolic” timed LFVP. In this sample the clot migrated proximally and is hidden within the catheter’s blue connecting tip. Image (middle left) shows dissolved clot constituent mixing up into the connecting line (mixing score graded 6, Relative Mixing Score therefore +6). Image (middle right) shows the clot after being flowed back to its original position. Image (bottom) shows the collected clot sample which had not fragmented.

References

    1. Writing Group members. Heart disease and stroke statistics—2010 update a report from the American Heart Association. Circulation. 2010;121:e46–e215. doi: 10.1161/CIRCULATIONAHA.109.192667. - DOI - PubMed
    1. Lincoff AM, Topol EJ. Illusion of reperfusion. Does anyone achieve optimal reperfusion during acute myocardial infarction? Circulation. 1993;88:1361–1374. doi: 10.1161/01.CIR.88.3.1361. - DOI - PubMed
    1. Jacobs AK, Antman EM, Ellrodt G. The American Heart Association’s Acute Myocardial Infarction (AMI) Advisory Working Group et al.Recommendation to develop strategies to increase the number of ST-segment-elevation myocardial infarction patients with timely access to primary percutaneous coronary intervention. Circulation. 2006;113:2152–2163. 10.161?CIRCULATIONAHA.106.174477. - PubMed
    1. Van de Werf F, Ardissino D, Betriu A, Cokkinos DV, Falk E, Fox KA, Julian D, Lengyel M, Neumann FJ, Ruzyllo W, Thygesen C, Underwood SR, Vahanian A, Verheugt FWA, Wijns W. Management of acute myocardial infarction in patients presenting with ST-segment elevation. The task force on the management of acute myocardial infarction of the European Society of Cardiology. Eur Heart J. 2003;24:28–66. doi: 10.1016/50195-668x(02)00618-8. - DOI - PubMed
    1. GUSTO The investigators. An international randomized trial comparing four thrombolytic strategies for acute myocardial infarction. N Engl J Med. 1993;329:673–682. doi: 10.1056/NEJM199309023291001. - DOI - PubMed

LinkOut - more resources