. 2014 Mar;24(3):663-76.
doi: 10.1093/cercor/bhs352. Epub 2012 Nov 11.

Tracking whole-brain connectivity dynamics in the resting state

Affiliations

Tracking whole-brain connectivity dynamics in the resting state

Elena A Allen et al. Cereb Cortex. 2014 Mar.

Abstract

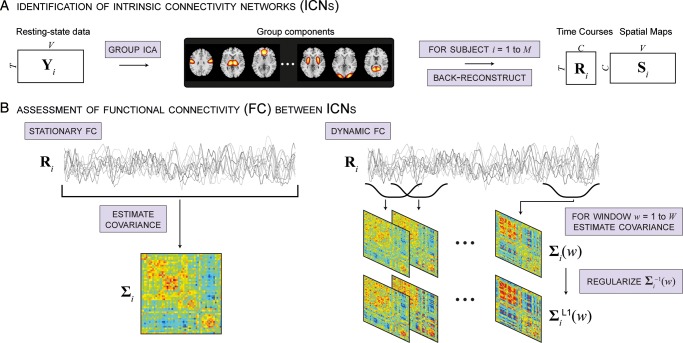
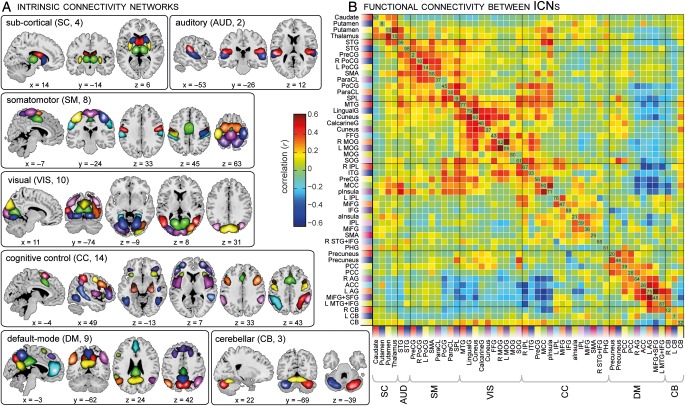
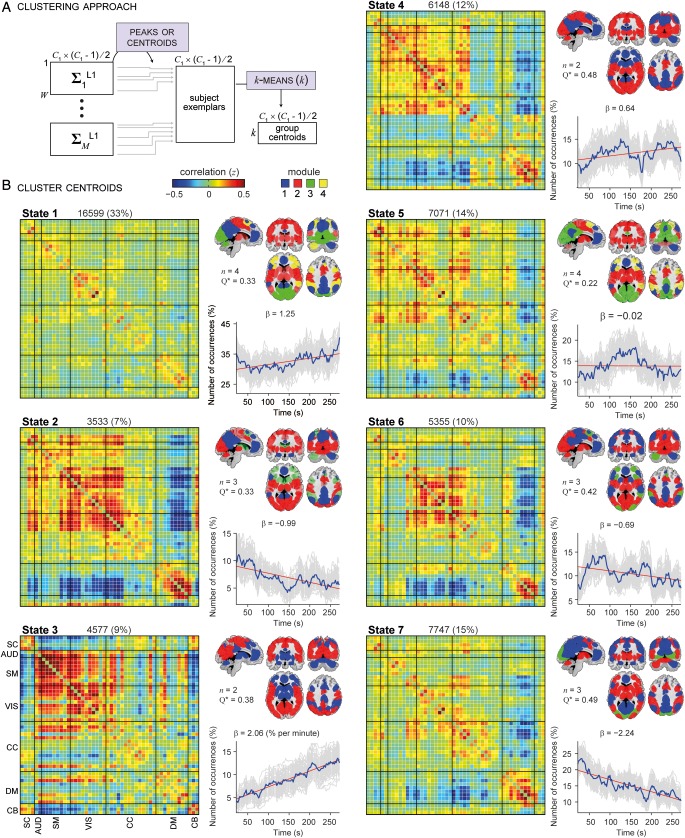
Spontaneous fluctuations are a hallmark of recordings of neural signals, emergent over time scales spanning milliseconds and tens of minutes. However, investigations of intrinsic brain organization based on resting-state functional magnetic resonance imaging have largely not taken into account the presence and potential of temporal variability, as most current approaches to examine functional connectivity (FC) implicitly assume that relationships are constant throughout the length of the recording. In this work, we describe an approach to assess whole-brain FC dynamics based on spatial independent component analysis, sliding time window correlation, and k-means clustering of windowed correlation matrices. The method is applied to resting-state data from a large sample (n = 405) of young adults. Our analysis of FC variability highlights particularly flexible connections between regions in lateral parietal and cingulate cortex, and argues against a labeling scheme where such regions are treated as separate and antagonistic entities. Additionally, clustering analysis reveals unanticipated FC states that in part diverge strongly from stationary connectivity patterns and challenge current descriptions of interactions between large-scale networks. Temporal trends in the occurrence of different FC states motivate theories regarding their functional roles and relationships with vigilance/arousal. Overall, we suggest that the study of time-varying aspects of FC can unveil flexibility in the functional coordination between different neural systems, and that the exploitation of these dynamics in further investigations may improve our understanding of behavioral shifts and adaptive processes.

Keywords: dynamics; fMRI; functional connectivity; independent component analysis; intrinsic activity; resting state; state variability.


Figures

Figure 1.
Figure 1.
Illustration of analysis steps. (A) Group ICA decomposes resting-state data from M = 405 subjects into C = 100 components, C1 = 50 of which are identified as intrinsic connectivity networks (ICNs). GICA1 back reconstruction is used to estimate the TCs (Ri) and SMs (Si) for each subject. (B) Stationary FC between components (left, ∑i) is estimated as the covariance of Ri. Dynamic FC (right, ∑iL1(w)) is estimated as the series of regularized covariance matrices from windowed portions of Ri.
Figure 2.
Figure 2.
ICN SMs (A) and the stationary FC between them (B). ICNs are divided into groups and arranged based on their anatomical and functional properties. Within each group, the color of the component in (A) corresponds to the colored flag shown along the axes of (B). FC was averaged over all subjects and inverse Fisher transformed (r = tanh(z)) for display, facilitating comparisons with previous studies. ICN labels in (B) denote the brain region with peak amplitude and refer to bilateral activations unless specified as left (L) or right (R). See Supplementary Figure S2 and Table S1 for more detailed information on each component. STG, superior temporal gyrus; PreCG, precentral gyrs; PoCG, postcentral gyrus; SMA, supplementary motor area; ParaCL, paracentral lobule; SPL, superior parietal lobule; MTG, middle temporal gyrus; FFG, fusiform grys; MOG, middle occipital gyrus; SOG, superior occipital gyrus; IPL, inferior parietal lobule; ITG, inferior temporal gryus; MCC, middle cingulate cortex; pInsula, posterior insula; MiFG, middle frontal gyrus; IFG, inferior frontal gyrus; aInsula, anterior insula; PHG, parahippocampal gyrus; PCC, posterior cingulate cortex; AG, angular gyrus; ACC, anterior cingulate cortex; SFG, superior frontal gyrus; CB, cerebellum.
Figure 3.
Figure 3.
Examples of FC dynamics for subject 124 (A), subject 267 (B) and subject 360 (C). (A1–C1) FC for each subject, averaged over all windows. (A2–C2) FC time series for connections between select pairs of ICNs. Correlation coefficients are plotted at the time point corresponding to the center of the window. Top panels show ∑iL1(w) for select windows. Highlighted connections are PreCG [2] to Thalamus [15] (light blue), L MOG [89] to R PoCG [10] (red), L IPL [76] to MOG [80] (orange), ACC [26] to R IPL [67] (dark blue), and MiFG + SFG [48] to L AG [75] (green). Highlighted windows are a subsample of the exemplars used in the clustering analysis (see Fig. 5A). (A3–C3) FC spectra for the time series in (A2–C2). Filled colored arrows marking the FC element locations in (A1–C1) correspond to the colored lines in (A2–C2) and (A3–C3).
Figure 4.
Figure 4.
Assessment of FC variability. (A) Amplitude of low-frequency (<0.025 Hz) FC oscillations between ICNs, averaged over subjects. Bins with greater amplitude indicate more variable FC. (B) Bootstrap partitioning procedure used to identify zone of instability (ZOI) scores for each component (see Materials and Methods section) (C) Surface rendering of ICNs with a ZOI score of >0.5.
Figure 5.
Figure 5.
Clustering approach (A) and result (B) for k = 7. Each cluster (States 1–7) is summarized with its centroid (left), modularity partition obtained with the Louvain algorithm for finding community structure (top right), and number of occurrences as a function of time (bottom right). The total number and percentage of occurrences is listed above each centroid and the number of modules (n) and modularity index (Q*, as defined in Rubinov and Sporns 2011) are adjacent to module depictions. Where possible, module colors (blue, red, green, and yellow) were matched across states such that similar partitions have the same color. As modularity partitions vary slightly from run-to-run, the Louvain algorithm was repeated on 100 bootstrap resamples (resampling ∑iL1(w) within each cluster) and consistency in modular assignment was mapped to color opacity (completely opaque = assigned to same module on all resamples; completely transparent = assigned to same module on 1/n resamples). beta Values indicate the slope (in units of percentage per minute) of the best linear fit (red) to the occurrence trend (blue). Light gray lines show occurrence profiles for 100 bootstrap resamples (resampling subjects).
Figure 6.
Figure 6.
Transitions between FC states. (A) State vectors for the 3 example subjects shown in Figure 3. Assigned states are plotted at the time point corresponding to the center of the sliding window. (B) The state transition matrix (TM), averaged over subjects. High values along the diagonal indicate a high probability of staying in a state. Note that transition probability is color-mapped on a log-scale. (C) The stationary probability vector (π, principal eigenvector of the TM) shows the steady state, or “long run” behavior. Error bars indicate the nonparametric 95% confidence intervals obtained from 1000 bootstrap resamples of the average TM (resampling subjects).

References

    1. Abou-Elseoud A, Starck T, Remes J, Nikkinen J, Tervonen O, Kiviniemi V. The effect of model order selection in group PICA. Hum Brain Mapp. 2010;31:1207–1216. - PMC - PubMed
    1. Aggarwal C, Hinneburg A, Keim D. Database Theory ICDT. 2001. On the surprising behavior of distance metrics in high dimensional space; pp. 420–434.
    1. Allen EA, Erhardt EB, Damaraju E, Gruner W, Segall JM, Silva RF, Havlicek M, Rachakonda S, Fries J, Kalyanam R, et al. A baseline for the multivariate comparison of resting-state networks. Front Syst Neurosci. 2011;5 - PMC - PubMed
    1. Allen EA, Erhardt EB, Wei Y, Eichele T, Calhoun VD. Capturing inter-subject variability with group independent component analysis of fMRI data: a simulation study. Neuroimage. 2012;59:4141–4159. - PMC - PubMed
    1. Arieli A, Sterkin A, Grinvald A, Aertsen A. Dynamics of ongoing activity: explanation of the large variability in evoked cortical responses. Science. 1996;273:1868–1871. - PubMed

Publication types