

Organization of the BcgI restriction-modification protein for the cleavage of eight phosphodiester bonds in DNA
- PMID: 23147005
- PMCID: PMC3592470
- DOI: 10.1093/nar/gks1023
Organization of the BcgI restriction-modification protein for the cleavage of eight phosphodiester bonds in DNA
Abstract
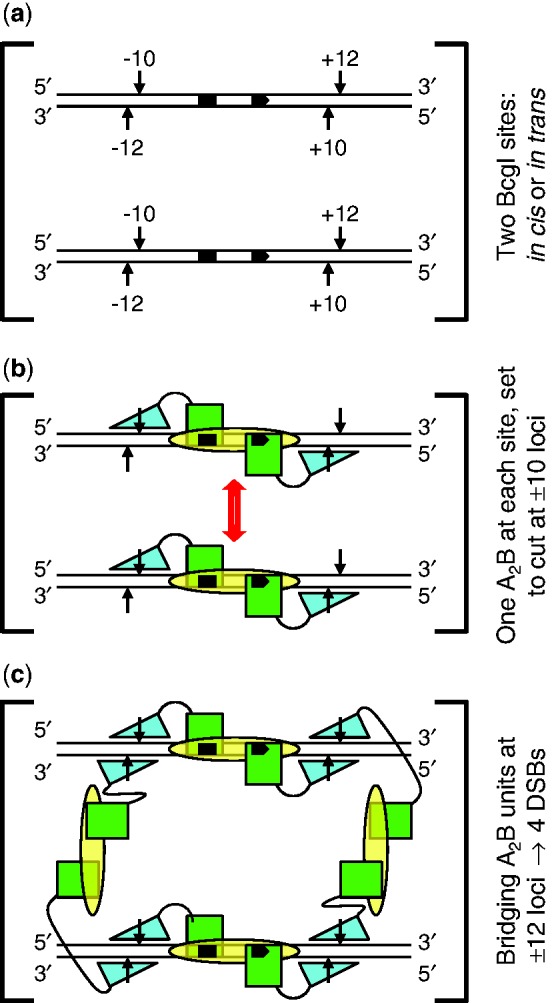
Type IIB restriction-modification systems, such as BcgI, feature a single protein with both endonuclease and methyltransferase activities. Type IIB nucleases require two recognition sites and cut both strands on both sides of their unmodified sites. BcgI cuts all eight target phosphodiester bonds before dissociation. The BcgI protein contains A and B polypeptides in a 2:1 ratio: A has one catalytic centre for each activity; B recognizes the DNA. We show here that BcgI is organized as A(2)B protomers, with B at its centre, but that these protomers self-associate to assemblies containing several A(2)B units. Moreover, like the well known FokI nuclease, BcgI bound to its site has to recruit additional protomers before it can cut DNA. DNA-bound BcgI can alternatively be activated by excess A subunits, much like the activation of FokI by its catalytic domain. Eight A subunits, each with one centre for nuclease activity, are presumably needed to cut the eight bonds cleaved by BcgI. Its nuclease reaction may thus involve two A(2)B units, each bound to a recognition site, with two more A(2)B units bridging the complexes by protein-protein interactions between the nuclease domains.
Figures
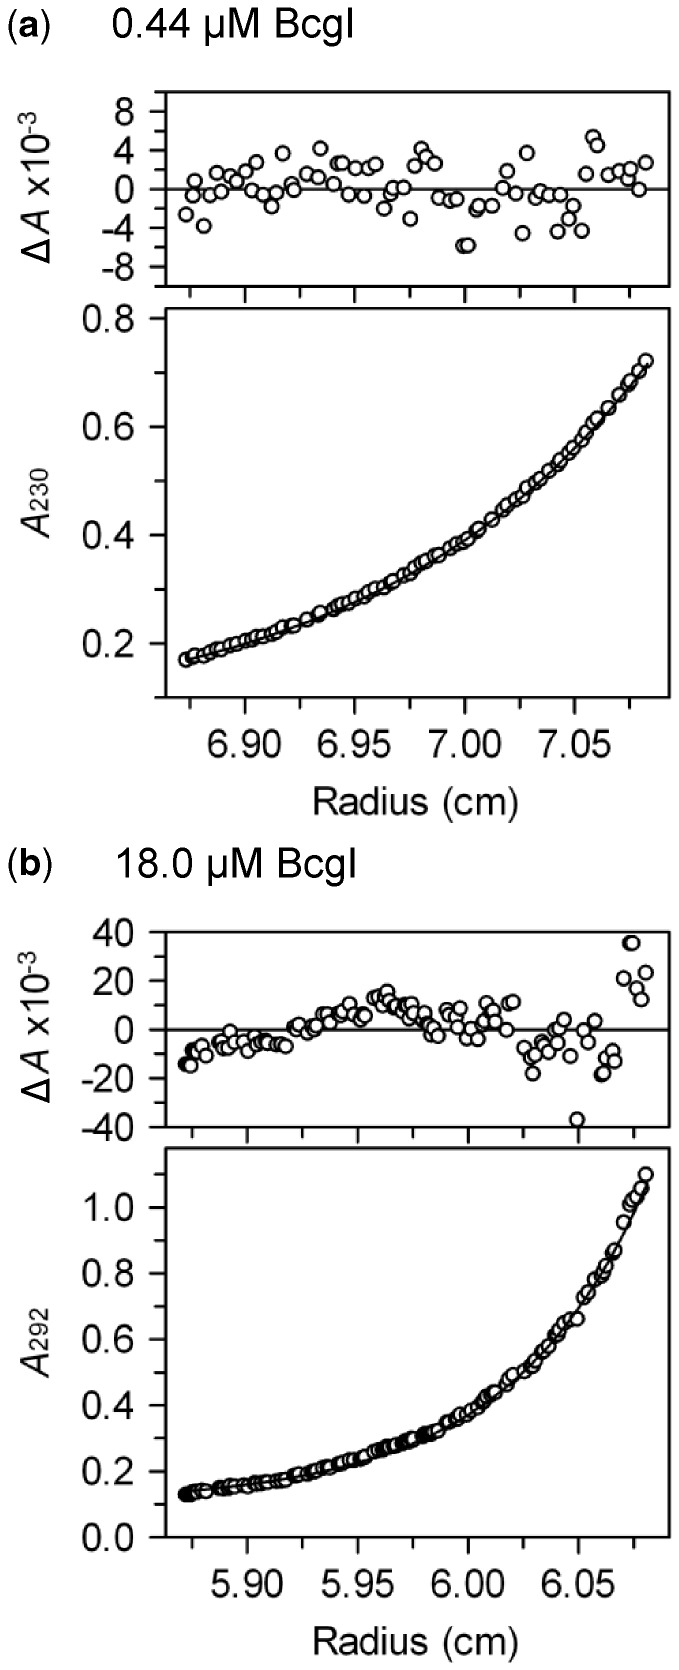
 value.
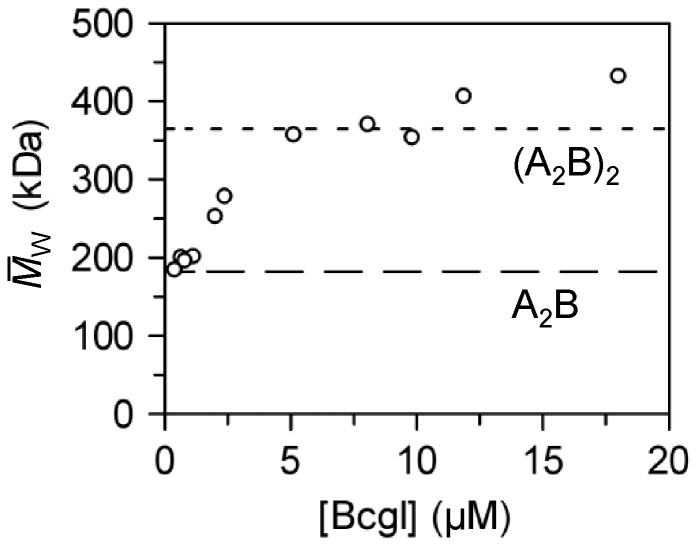
 value. The
 values are plotted against the
loading concentrations of BcgI. The values expected for the 182.4 kDa A2B
protomer and for the 365 kDa (A2B)2 dimer are marked with long
and short dashes, respectively.
values are plotted against the
loading concentrations of BcgI. The values expected for the 182.4 kDa A2B
protomer and for the 365 kDa (A2B)2 dimer are marked with long
and short dashes, respectively.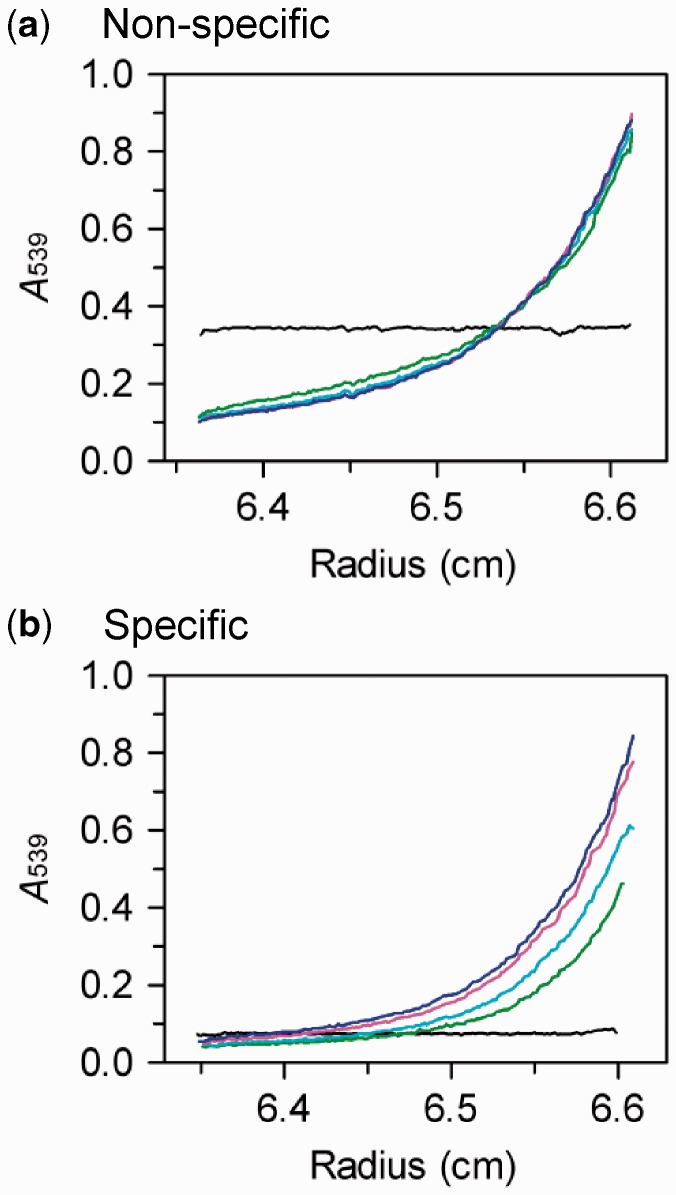
 of 349 kDa.
Similar articles
-
Organization of the BcgI restriction-modification protein for the transfer of one methyl group to DNA.Nucleic Acids Res. 2013 Jan 7;41(1):405-17. doi: 10.1093/nar/gks1000. Epub 2012 Nov 11. Nucleic Acids Res. 2013. PMID: 23147004 Free PMC article.
-
Concerted action at eight phosphodiester bonds by the BcgI restriction endonuclease.Nucleic Acids Res. 2011 Sep 1;39(17):7630-40. doi: 10.1093/nar/gkr453. Epub 2011 Jun 7. Nucleic Acids Res. 2011. PMID: 21653548 Free PMC article.
-
TstI, a Type II restriction-modification protein with DNA recognition, cleavage and methylation functions in a single polypeptide.Nucleic Acids Res. 2014 May;42(9):5809-22. doi: 10.1093/nar/gku187. Epub 2014 Mar 14. Nucleic Acids Res. 2014. PMID: 24634443 Free PMC article.
-
The reaction mechanism of FokI excludes the possibility of targeting zinc finger nucleases to unique DNA sites.Biochem Soc Trans. 2011 Apr;39(2):584-8. doi: 10.1042/BST0390584. Biochem Soc Trans. 2011. PMID: 21428944 Review.
-
The type IIB restriction endonucleases.Biochem Soc Trans. 2010 Apr;38(2):410-6. doi: 10.1042/BST0380410. Biochem Soc Trans. 2010. PMID: 20298193 Review.
Cited by
-
Type II restriction endonucleases--a historical perspective and more.Nucleic Acids Res. 2014 Jul;42(12):7489-527. doi: 10.1093/nar/gku447. Epub 2014 May 30. Nucleic Acids Res. 2014. PMID: 24878924 Free PMC article. Review.
-
Structure of 5-hydroxymethylcytosine-specific restriction enzyme, AbaSI, in complex with DNA.Nucleic Acids Res. 2014 Jul;42(12):7947-59. doi: 10.1093/nar/gku497. Epub 2014 Jun 3. Nucleic Acids Res. 2014. PMID: 24895434 Free PMC article.
-
Modification-dependent restriction endonuclease, MspJI, flips 5-methylcytosine out of the DNA helix.Nucleic Acids Res. 2014 Oct 29;42(19):12092-101. doi: 10.1093/nar/gku871. Epub 2014 Sep 27. Nucleic Acids Res. 2014. PMID: 25262349 Free PMC article.
-
Organization of the BcgI restriction-modification protein for the transfer of one methyl group to DNA.Nucleic Acids Res. 2013 Jan 7;41(1):405-17. doi: 10.1093/nar/gks1000. Epub 2012 Nov 11. Nucleic Acids Res. 2013. PMID: 23147004 Free PMC article.
-
Highlights of the DNA cutters: a short history of the restriction enzymes.Nucleic Acids Res. 2014 Jan;42(1):3-19. doi: 10.1093/nar/gkt990. Epub 2013 Oct 18. Nucleic Acids Res. 2014. PMID: 24141096 Free PMC article.
References
Publication types
MeSH terms
Substances
Grants and funding
LinkOut - more resources
Full Text Sources
Molecular Biology Databases
