

Cholera toxin induces a shift from inactive to active cyclooxygenase 2 in alveolar macrophages activated by Mycobacterium bovis BCG
- PMID: 23147035
- PMCID: PMC3536154
- DOI: 10.1128/IAI.01031-12
Cholera toxin induces a shift from inactive to active cyclooxygenase 2 in alveolar macrophages activated by Mycobacterium bovis BCG
Abstract
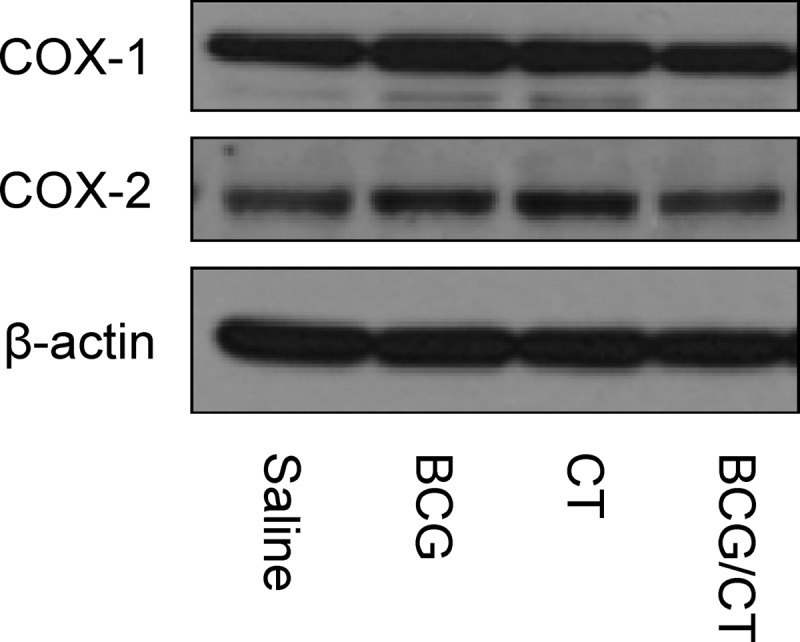
Intranasal vaccination stimulates formation of cyclooxygenases (COX) and release of prostaglandin E(2) (PGE(2)) by lung cells, including alveolar macrophages. PGE(2) plays complex pro- or anti-inflammatory roles in facilitating mucosal immune responses, but the relative contributions of COX-1 and COX-2 remain unclear. Previously, we found that Mycobacterium bovis BCG, a human tuberculosis vaccine, stimulated increased release of PGE(2) by macrophages activated in vitro; in contrast, intranasal BCG activated no PGE(2) release in the lungs, because COX-1 and COX-2 in alveolar macrophages were subcellularly dissociated from the nuclear envelope (NE) and catalytically inactive. This study tested the hypothesis that intranasal administration of BCG with cholera toxin (CT), a mucosal vaccine component, would shift the inactive, NE-dissociated COX-1/COX-2 to active, NE-associated forms. The results showed increased PGE(2) release in the lungs and NE-associated COX-2 in the majority of COX-2(+) macrophages. These COX-2(+) macrophages were the primary source of PGE(2) release in the lungs, since there was only slight enhancement of NE-associated COX-1 and there was no change in COX-1/COX-2 levels in alveolar epithelial cells following treatment with CT and/or BCG. To further understand the effect of CT, we investigated the timing of BCG versus CT administration for in vivo and in vitro macrophage activations. When CT followed BCG treatment, macrophages in vitro had elevated COX-2-mediated PGE(2) release, but macrophages in vivo exhibited less activation of NE-associated COX-2. Our results indicate that inclusion of CT in the intranasal BCG vaccination enhances COX-2-mediated PGE(2) release by alveolar macrophages and further suggest that the effect of CT in vivo is mediated by other lung cells.
Figures


Similar articles
-
Catalytically inactive cyclooxygenase 2 and absence of prostaglandin E2 biosynthesis in murine peritoneal macrophages following in vivo phagocytosis of heat-killed Mycobacterium bovis bacillus Calmette-Guérin.J Immunol. 2007 Nov 15;179(10):7072-8. doi: 10.4049/jimmunol.179.10.7072. J Immunol. 2007. PMID: 17982098
-
Persistent inactivation of macrophage cyclooxygenase-2 in mycobacterial pulmonary inflammation.Am J Respir Cell Mol Biol. 2009 Aug;41(2):146-54. doi: 10.1165/rcmb.2008-0230OC. Epub 2008 Dec 18. Am J Respir Cell Mol Biol. 2009. PMID: 19097981 Free PMC article.
-
Differential subcellular localization of COX-2 in macrophages phagocytosing heat-killed Mycobacterium bovis BCG.Am J Physiol Cell Physiol. 2007 Jul;293(1):C184-90. doi: 10.1152/ajpcell.00346.2006. Epub 2007 Mar 21. Am J Physiol Cell Physiol. 2007. PMID: 17376818
-
Heat-killed BCG induces biphasic cyclooxygenase 2+ splenic macrophage formation--role of IL-10 and bone marrow precursors.J Leukoc Biol. 2006 Sep;80(3):590-8. doi: 10.1189/jlb.1205737. Epub 2006 Jul 5. J Leukoc Biol. 2006. PMID: 16822852
-
Role of PPARγ in COX-2 activation in mycobacterial pulmonary inflammation.Inflammation. 2012 Oct;35(5):1685-95. doi: 10.1007/s10753-012-9486-x. Inflammation. 2012. PMID: 22696146 Free PMC article.
References
-
- Negri DR, Pinto D, Vendetti S, Patrizio M, Sanchez M, Riccomi A, Ruggiero P, Del Giudice G, De Magistris MT. 2009. Cholera toxin and Escherichia coli heat-labile enterotoxin, but not their nontoxic counterparts, improve the antigen-presenting cell function of human B lymphocytes. Infect. Immun. 77:1924–1935 - PMC - PubMed
-
- Morsy MA, Isohama Y, Miyata T. 2001. Prostaglandin E(2) increases surfactant secretion via the EP(1) receptor in rat alveolar type II cells. Eur. J. Pharmacol. 426:21–24 - PubMed
-
- Savla U, Appel HJ, Sporn PH, Waters CM. 2001. Prostaglandin E(2) regulates wound closure in airway epithelium. Am. J. Physiol. Lung Cell. Mol. Physiol. 280:L421–L431 - PubMed
-
- Vancheri C, Mastruzzo C, Sortino MA, Crimi N. 2004. The lung as a privileged site for the beneficial actions of PGE2. Trends Immunol. 25:40–46 - PubMed
Publication types
MeSH terms
Substances
Grants and funding
LinkOut - more resources
Full Text Sources
Research Materials
