. 2012 Dec;22(12):1666-80.
doi: 10.1038/cr.2012.151. Epub 2012 Nov 13.

The novel quantitative trait locus GL3.1 controls rice grain size and yield by regulating Cyclin-T1;3

Affiliations

The novel quantitative trait locus GL3.1 controls rice grain size and yield by regulating Cyclin-T1;3

Peng Qi et al. Cell Res. 2012 Dec.

Abstract

Increased crop yields are required to support rapid population growth worldwide. Grain weight is a key component of rice yield, but the underlying molecular mechanisms that control it remain elusive. Here, we report the cloning and characterization of a new quantitative trait locus (QTL) for the control of rice grain length, weight and yield. This locus, GL3.1, encodes a protein phosphatase kelch (PPKL) family - Ser/Thr phosphatase. GL3.1 is a member of the large grain WY3 variety, which is associated with weaker dephosphorylation activity than the small grain FAZ1 variety. GL3.1-WY3 influences protein phosphorylation in the spikelet to accelerate cell division, thereby resulting in longer grains and higher yields. Further studies have shown that GL3.1 directly dephosphorylates its substrate, Cyclin-T1;3, which has only been rarely studied in plants. The downregulation of Cyclin-T1;3 in rice resulted in a shorter grain, which indicates a novel function for Cyclin-T in cell cycle regulation. Our findings suggest a new mechanism for the regulation of grain size and yield that is driven through a novel phosphatase-mediated process that affects the phosphorylation of Cyclin-T1;3 during cell cycle progression, and thus provide new insight into the mechanisms underlying crop seed development. We bred a new variety containing the natural GL3.1 allele that demonstrated increased grain yield, which indicates that GL3.1 is a powerful tool for breeding high-yield crops.


Figures

Figure 1
Figure 1
Map-based cloning of GL3.1. (A) FAZ1 and WY3 rice grains. Scale bar, 2 mm. (B) Genetic location of GL3.1 and progeny testing of fixed recombinant plants. The numbers indicate the number of recombinant plants between GL3.1 and molecular markers. R1-R5, five recombinant lines; C1, control 1 (FAZ1 homozygous); C2, control 2 (WY3 homozygous). Grain length (mean ± SD) of R2, R5 and C2 is greater than R1, R3, R4 and C1 (n = 10 plants). The white and blue areas represent FAZ1 and WY3 homozygous chromosomal segments, respectively. (C) FAZ1 and NIL grains. Scale bar, 2 mm. (D-G) Comparison of FAZ1 and NIL grain length (n = 20) (D), grain width (n = 20) (E), grain thickness (n = 20) (F) and 1 000-grain weight (n = 20) (G). (H, I) Time course of FAZ1 and NIL endosperm fresh weight (H) and endosperm dry weight (I) (n = 40 plants). (J) FAZ1 and NIL plot yield (plot area: 9.6 m2) (n = 2). A Student's t-test was used to generate the P values in D-G and J.
Figure 2
Figure 2
Transgenic analysis of GL3.1. (A) GL3.1 gene structure. Orange blocks indicate exons; black lines indicate introns; numbers indicate the intron (top) and exon (below) sizes (bp); purple and green blocks indicate conserved domains. (B) Grain phenotypes of GL3.1-WY3-overexpressing transgenic lines. Scale bar, 2 mm. (C) Grain length of GL3.1-WY3-overexpressing transgenic lines (n = 10). (D) Real-time PCR analysis of GL3.1 expression in GL3.1-WY3-overexpressing transgenic lines; the expression levels have been normalized to those of ubiquitin and are expressed relative to the vector (n =3). A Student's t-test was used to generate the P values in C.
Figure 3
Figure 3
Expression pattern and molecular function of GL3.1. (A) Real-time PCR analysis of GL3.1 expression in FAZ1 and NIL during the heading stage; the expression levels have been normalized to ubiquitin and are expressed relative to FAZ1 seedling leaves (n = 3). (B) Subcellular location of GL3.1. GL3.1 was fused to enhanced yellow fluorescent protein (eYFP), under the control of the 35S promoter, and transformed into Arabidopsis protoplasts before examination using confocal laser-scanning microscopy. Scale bar, 10 μm. (C) The enzymatic activity of GL3.1. GL3.1-FAZ1, GL3.1-WY3 and GL3.1 from Nanyangzhan (GL3.1-NYZ) was examined using MBP fusions. The amount (pmol) of free phosphates released by GL3.1-FAZ1::MBP, GL3.1-WY3::MBP, GL3.1-M1::MBP, GL3.1-M2:MBP and MBP was recorded (n = 3); the P value was generated by comparing GL3.1-WY3::MBP, GL3.1-M1::MBP and GL3.1-M2::MBP with GL3.1-FAZ1::MBP. (D) Pharmacological testing of GL3.1 phosphatase activity (n = 3). The P value was generated through a comparison of the GL3.1-FAZ1::MBP (with inhibitors) with GL3.1-FAZ1::MBP (without inhibitors). A Student's t-test was used to generate the P values in A, C and D.
Figure 4
Figure 4
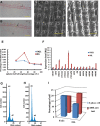
GL3.1 alters spikelet hull cell division to regulate grain length. (A, B) Longitudinal sections of FAZ1 (A) and NIL (B) lemma before flowering. Scale bar, 100 μm. (C, D) Scanning electron microscopic analysis of the outer spikelet hull surfaces of FAZ1 (C) and NIL (D). Scale bar, 100 μm. (E) Flow cytometric analysis of FAZ1 and NIL spikelet hulls at five developmental stages (n = 50). The percentage of cells with 4C DNA content was determined as a proportion of the total number of isoploid and tetraploid nuclei. (F) Quantitative real-time PCR analysis of cell cycle-related gene expression in FAZ1 and NIL spikelets during the heading stage. The expression of these genes in the spikelet of NIL was normalized to that of ubiquitin and expressed relative to FAZ1 spikelets at this stage (n = 3). (G-H) Flow cytometric analysis showing that the cells of FAZ1 (G) contain less 4C DNA than those of NIL (H). (I) Percentage of cells in S phase, and the number of cells containing 4C DNA content in FAZ1 and NIL at 8 h after release.
Figure 5
Figure 5
GL3.1 and Cyclin-T1:3 interact. (A) Yeast two-hybrid assay confirmed the interaction between GL3.1-FAZ1 and Cyclin-T1;3. GL3.1-FAZ1 was fused with the bait in PPC86, and Cyclin-T1;3 was cloned into PEG202-GL3.1-FAZ1 with the prey. (B) Nuclear localization of Cyclin-T1;3. Cyclin-T1;3 was fused to CFP, transformed into Arabidopsis protoplasts and observed using confocal laser-scanning microscopy. Left panel: CFP; middle panel: bright field; right panel: merge. Scale bar, 10 μm. (C) Co-expression of eYFP::GL3.1-FAZ1 or eYFP::GL3.1-WY3 with Cerulean::Cyclin-T1;3 and SV40 nuclear localization signal (NLS) were fused with mRFP in Arabidopsis protoplasts. Scale bar, 10 μm. (D) GL3.1 dephosphorylates the phosphorylated form of Cyclin-T1;3::GST. The amount (pmol) of free phosphate released by GL3.1-FAZ1::MBP, GL3.1-WY3::MBP, GL3.1-M1::MBP, GL3.1-M2:MBP and MBP was recorded (n = 3). The P value was obtained through a comparison of GL3.1-WY3::MBP, GL3.1-M1::MBP and GL3.1-M2::MBP with GL3.1-FAZ1::MBP. (E) BiFC assay confirmed the interaction between the N-terminus of GL3.1 and Cyclin-T1;3. Truncated GL3.1 lacking the GL3.1 phosphatase domain (ΔP) from both parents was fused with the N-terminus of YFP, whereas Cyclin-T1;3 was fused with the C-terminus of YFP. Scale bar, 50 μm. (F) Real-time PCR analysis of Cyclin-T1;3 expression in FAZ1 and NIL cells after release; the expression levels were normalized to those of ubiquitin and are expressed relative to those of FAZ1 cells at 0 h after release (n = 3). (G) Grain phenotypes of Cyclin-T1;3 antisense transgenic lines. Scale bar, 2 mm. (H) Grain length of Cyclin-T1;3 antisense transgenic lines (n = 10). (I) Real-time PCR analysis of Cyclin-T1;3 expression in Cyclin-T1;3 antisense transgenic lines; the expression levels were normalized to those of ubiquitin and are expressed relative to the vector (n =3). A Student's t-test was used to generate the P values in D and H.
Figure 6
Figure 6
GL3.1 influences protein phosphorylation status as a potential model for grain size control. (A) Differences in the quantities of phosphoproteins in FAZ1 and NIL. iTRAQ was used to determine the protein quantities. The proteins from FAZ1 were labelled with 114 and 116, whereas the proteins from NIL were labelled with 115 and 117. Ratio-1 corresponds to 115/114, while ratio-2 corresponds to 117/116. (B) The proteins mentioned in A are involved in various biological processes. The number of proteins associated with each biological process was calculated in REIVGO (revigo.irb.hr) using the –log10 P-value method. a to j represent distinct biological processes. a, positive regulation of nucleobase, nucleoside, nucleotide and nucleic acid metabolism; b, transcription initiation from RNA polymerase II promoter; c, positive regulation of biological processes; d, transcription from RNA Polymerase II promoter; e, transcription initiation, DNA-dependent; f, protein complex assembly; g, protein complex biogenesis; h, macromolecular complex subunit organization; i, cellular carbohydrate metabolism; j, carbohydrate metabolism. (C, D) Potential model for the regulation of grain size through GL3.1. GL3.1 dephosphorylates substrates, such as Cyclin-T1;3, which promotes spikelet hull cell proliferation. In the FAZ1 allele, most phosphorylated substrates (green triangles, red circles) are dephosphorylated through GL3.1-FAZ1, which results in normal spikelet hull development (C). In the WY3 allele, the weaker dephosphorylation activity of GL3.1-WY3 may result in the accumulation of phosphorylated substrates, thereby increasing the rate of cell division (D) and accelerating milk filling to result in a longer grain.

References

    1. Tilman D, Fargione J, Wolff B, et al. Forecasting agriculturally driven global environmental change. Science. 292:281–284. - PubMed
    1. Hibberd JM, Sheehy JE, Langdale JA. Using C4 photosynthesis to increase the yield of rice-rationale and feasibility. Curr Opin Plant Biol. 2008;11:228–231. - PubMed
    1. Khush GS. Green revolution: preparing for the 21st century. Genome. 1999;42:646–655. - PubMed
    1. Khush GS. What it will take to feed 5.0 billion rice consumers in 2030. Plant Mol Biol. 2005;59:1–6. - PubMed
    1. Zhang Q. Strategies for developing Green Super Rice. Proc Natl Acad Sci USA. 2007;104:16402–16409. - PMC - PubMed

Publication types

MeSH terms