. 2012 Dec;33(23):3466-79.
doi: 10.1002/elps.201200164. Epub 2012 Nov 12.

Toward detection of DNA-bound proteins using solid-state nanopores: insights from computer simulations

Affiliations

Toward detection of DNA-bound proteins using solid-state nanopores: insights from computer simulations

Jeffrey Comer et al. Electrophoresis. 2012 Dec.

Abstract

Through all-atom molecular dynamics simulations, we explore the use of nanopores in thin synthetic membranes for detection and identification of DNA binding proteins. Reproducing the setup of a typical experiment, we simulate electric field driven transport of DNA-bound proteins through nanopores smaller in diameter than the proteins. As model systems, we use restriction enzymes EcoRI and BamHI specifically and nonspecifically bound to a fragment of dsDNA, and streptavidin and NeutrAvidin proteins bound to dsDNA and ssDNA via a biotin linker. Our simulations elucidate the molecular mechanics of nanopore-induced rupture of a protein-DNA complex, the effective force applied to the DNA-protein bond by the electrophoretic force in a nanopore, and the role of DNA-surface interactions in the rupture process. We evaluate the ability of the nanopore ionic current and the local electrostatic potential measured by an embedded electrode to report capture of DNA, capture of a DNA-bound protein, and rupture of the DNA-protein bond. We find that changes in the strain on dsDNA can reveal the rupture of a protein-DNA complex by altering both the nanopore ionic current and the potential of the embedded electrode. Based on the results of our simulations, we suggest a new method for detection of DNA binding proteins that utilizes peeling of a nicked double strand under the electrophoretic force in a nanopore.


Figures

Figure 1
Figure 1
Detection of a DNA-bound protein using a nanopore. (a) A protein–DNA complex is threaded through a nanopore wider than the complex. The protein is detected as a modulation of the nanopore ionic current. (b) A protein–DNA complex halts DNA transport when a protein encounters a nanopore smaller than the protein. The protein can be detected and, possibly, identified by measuring the nanopore ionic current, a lifetime of the protein–DNA complex near the nanopore, and signals associated with the local structure of the DNA in the pore constriction (see also Fig. 2).
Figure 2
Figure 2
Idealized schematics of protein detection using nanopore force spectroscopy. (a) The transmembrane bias V0 induces ionic current I0 through an open pore. (b) A molecule of DNA is captured by the pore opening and the DNA begins to thread through the pore. The nanopore ionic current rises to I1 due to the increased concentration of ions near the DNA. The potential on the membrane electrode drops due to the presence of the DNA. The DNA is expected to produce enhancements of the ionic current at physiological salt concentrations (∼ 0.1 M KCl), and blockades at KCl concentrations exceeding 0.5 M [46]. (c) DNA is threaded through the pore. (d) A protein bound to the DNA reaches the pore and halts the translocation. Ionic current decreases to I2 due to blockage of the pore by the protein. The device detects halting of translocation by the change in the current. (e) The bias is increased slowly beyond V0, producing an increasing stress on the protein–DNA bond. The strain on the DNA reduces its linear charge density and can be recognized from the change in the potential on the membrane electrode. The ionic current rises with the bias; however, the rise is not linear as explained in the text. (f) The bias reaches a sufficiently large value that the protein dissociates from the DNA. The value of the bias at which rupture occurs can be used to identify the bound protein. The ionic current rises because the protein no longer obstructs the pore opening. The relaxation of the DNA can be recognized in the potential on the membrane electrode. (g) The bias is reduced once more to V0 to prepare for the arrival of the next protein. The ionic current returns to I1. Steps d–g are repeated until the DNA exits the pore. (i) Diagram of the bias applied transverse to the membrane by the Ag/AgCl electrodes immersed in the solution during each step in the process. (j) Diagram of the ionic current through the pore. (h) Diagram of the electric potential of the electrode embedded in the membrane. ✯ The ionic current levels depend on the conditions of experiment (see text).
Figure 3
Figure 3
MD simulation of protein–DNA rupture. The silicon nitride membrane is shown as a molecular surface, the BamHI protein is drawn using vdW spheres; dsDNA is schematically shown using a ball-and-stick model. The snapshots illustrate the initial state of the system (a), the moment the protein reaches the surface of the membrane (b), rupture of the protein–DNA bond (c), and subsequent transport of dsDNA (d and e). Note that the protein does not dissociate from DNA. To the contrary, the DNA is observed to slide along the protein, rotating clockwise as it moves through the nanopore. This MD trajectory was obtained under a 2.0 V transmembrane bias.
Figure 4
Figure 4
Restriction enzyme systems used for MD simulations of protein detection. Shown are (a) EcoRI bound to its cognate sequence, (b) BamHI bound to its cognate sequence, and (c) BamHI bound to a sequence that differs from the cognate sequence by a single basepair. (d-f) Dependence of enzyme-DNA rupture on the bias and type of enzyme. The separation plotted is the distance between the center of mass of the glutamic acid (E113) in the enzyme's active site [34] and the phosphate of the third nucleotide in the cognate sequence (GAATTC for EcoRI and GGATCC for BamHI). Sharp increases in this distance indicate rupture of the enzyme–DNA complex. Two trajectories are shown for BamHI cognate at 2 V, panel e. Note that the scale of the time axis differs between the three plots.
Figure 5
Figure 5
Time to rupture versus transmembrane bias for three enzyme–DNA systems: EcoRI bound to its cognate sequence (black circles), BamHI bound to its cognate sequence (red squares), and BamHI bound nonspecifically (blue diamonds). In the case of the cognate BamHI system, two independent runs were performed at 2 V. At 1 V for this system, rupture was not observed within 70 ns. Lines are guides to the eye. Note that the rupture time is on a logarithmic scale.
Figure 6
Figure 6
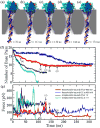
MD simulations of the effective force on the protein–DNA bond. (a–e) Five representative snapshots illustrating an MD trajectory of NeutrAvidin-bound AT homopolymer at a 400 mV bias. The NeutrAvidin protein is shown as vdW spheres, while the DNA strands carrying adenine and thymine nucleotides are shown in blue and orange respectively. (a) Base pairs near the top of the dsDNA start to disassociate at t = 32 ns. (b) Base pairing of the dsDNA at the constriction starts to break down at t = 112 ns. (c) Conformation of the dsDNA when the force on biotin reaches its maximum at t = 130 ns. (d) More base-pair disassociations at t = 144 ns. (e) Conformation of the dsDNA after reaching its steady state at t = 174 ns. (f) A plot showing the time dependence of the number of base pairs remaining above the constriction. See panel (e) for color legend. (g) A plot illustrating the effective force on biotin along the NeutrAvidin/streptavidin binding pocket versus time. The arrows in f and g correspond to the time when the snapshots (ae) are taken.
Figure 7
Figure 7
(a) Chemical structure of a biotin-linker-ssDNA fragment. (b) Tension versus extension plot for a linker connecting biotin to ssDNA. Each data point corresponds to an MD simulation of the system shown in the inset, where a constant force was applied to one atom of the linker while streptavidin was spatially restrained. The extension was measured between the two atoms shown in the inset as red and blue spheres. The inset schematically shows the systems used for calibration simulations. The streptavidin pocket is shown as a molecular surface, biotin, linker and the first nucleotide of a DNA strand are shown as bonds colored according to the atom type: nitrogen (blue), oxygen (red), hydrogen (white), cyan (carbon), phosphorous (gold). A fit to the data (solid line) was used to relate the extension of the linker in nanopore simulations to the effective force applied to the DNA-protein bond, Fig. 6f.
Figure 8
Figure 8
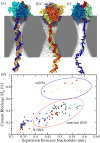
Local structure of DNA in the pore constriction. (a-c) Three representative conformations of streptavidin/NeutrAvidin-bound DNA in a silicon nitride nanopore. The streptavidin/NeutrAvidin protein is shown as vdW spheres, while the A, C, T and G DNA bases are shown in the cartoon representation and colored in blue, yellow, orange and red respectively. (a) Typical conformation of B-DNA. Shown in the figure is a NeutrAvidin-bound AT homopolymer trapped in a parabolic 2.6×2.4 nm silicon nitride pore in its canonical form at 400 mV. (b) Typical conformation of stretched dsDNA conformation. Shown in the figure is a streptavidin-bound GC homopolymer trapped in a bi-conical 2.6×2.4 nm silicon nitride pore stretched by 60% at 1.0 V. (c) Typical conformation of stretched ssDNA. Shown in the figure is a NeutrAvidin-bound polyA ssDNA trapped in a parabolic 2.6×2.4 nm silicon nitride pore at 400 mV. (d) A plot showing the relationship between the ionic current blockage (I/I0) and the stretching of DNA. Three groups of conformation can be categorized: B-DNA (orange circle), stretched dsDNA (red circle), and ssDNA (blue circle). Symbols: AT/A and GC/G homopolymers are shown solid and hollow symbol respectively. Circles represent streptavidin-bound dsDNA at 1.0 V, squares represent NeutrAvidin-bound dsDNA at 400 mV, while triangles represent NeutrAvidin-bound ssDNA at 400 mV.
Figure 9
Figure 9
The electric potential on electrodes embedded in the pore is approximately proportional to the inverse length of the DNA segment within the pore. The black line shows the inverse of the average basepair length for the 10 basepairs nearest to the pore center (see the text for more details) during the simulation. The red circles show the electrode potential at the corresponding times, estimated as in Sigalov et al. [73] and scaled according to Eq. 4. The dashed blue line shows the approximate time at which the DNA and enzyme dissociated. (a) Simulation of EcoRI and cognate DNA at 4 V. (b) Simulation of BamHI and cognate DNA at 2 V.

Similar articles

Cited by

References

    1. Li J, Stein D, McMullan C, Branton D, Aziz MJ, Golovchenko JA. Nature. 2001;412:166–169. - PubMed
    1. Dekker C. Nature Nanotech. 2007;2:209–215. - PubMed
    1. Storm AJ, Chen JH, Zandbergen HW, Dekker C. Phys Rev E. 2005;71:051903–051913. - PubMed
    1. Skinner GM, van den Hout M, Broekmans O, Dekker C, Dekker NH. Nano Lett. 2009;9:2953–2960. - PubMed
    1. Wanunu M, Dadosh T, Ray V, Jin J, McReynolds L, Drndic M. Nature Nanotech. 2010;5:807–814. - PubMed

Publication types