. 2013 Jan 4;288(1):709-22.
doi: 10.1074/jbc.M112.424671. Epub 2012 Nov 12.

Kinetic characterization of nonmuscle myosin IIb at the single molecule level

Affiliations

Kinetic characterization of nonmuscle myosin IIb at the single molecule level

Attila Nagy et al. J Biol Chem. .

Abstract

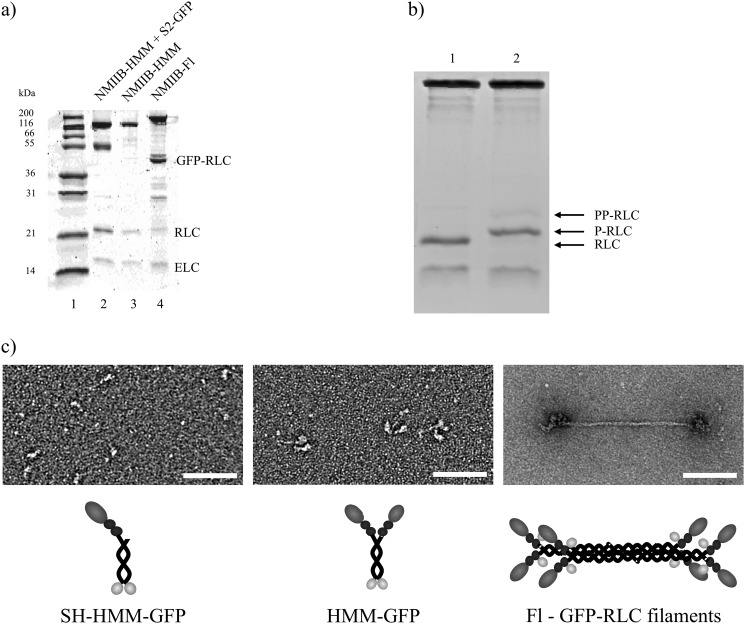
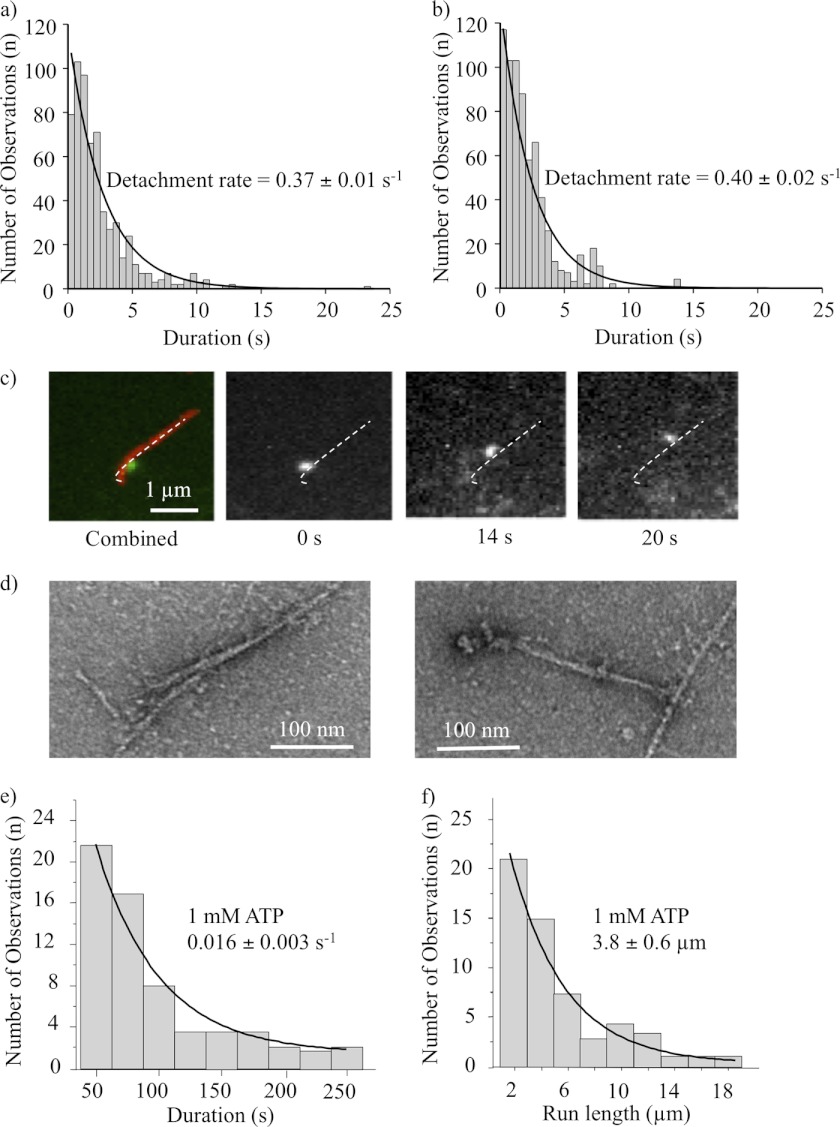
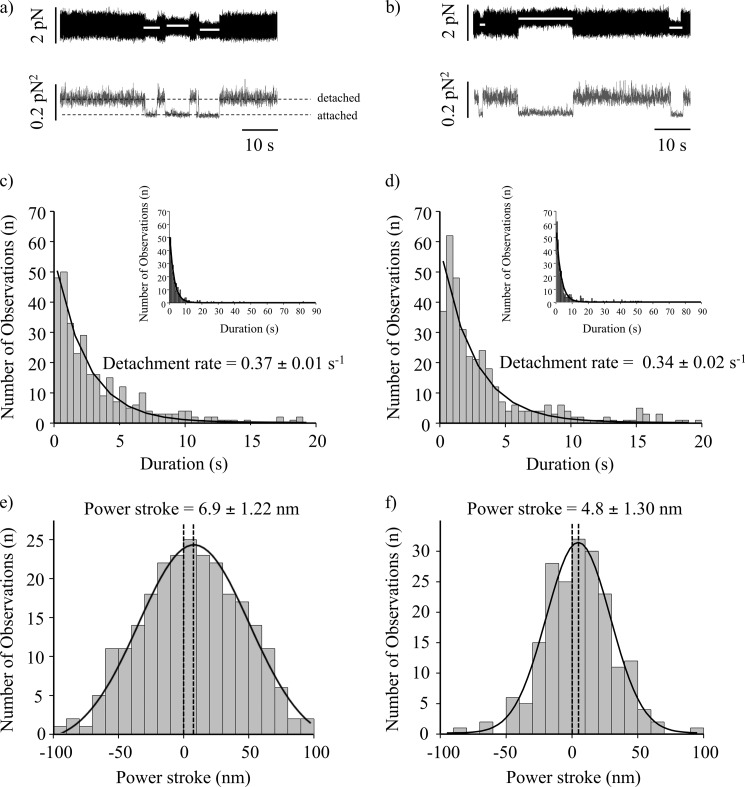
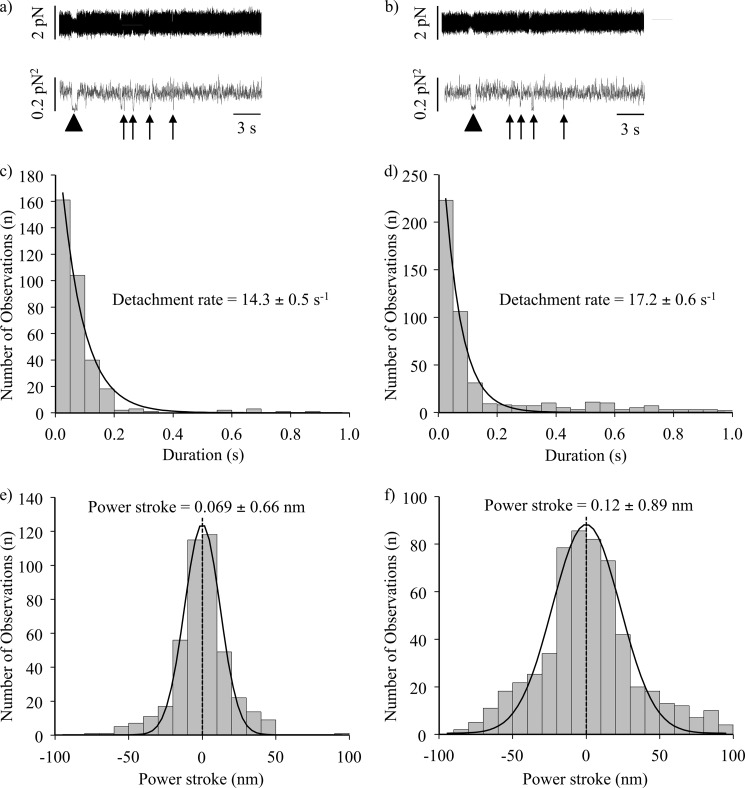
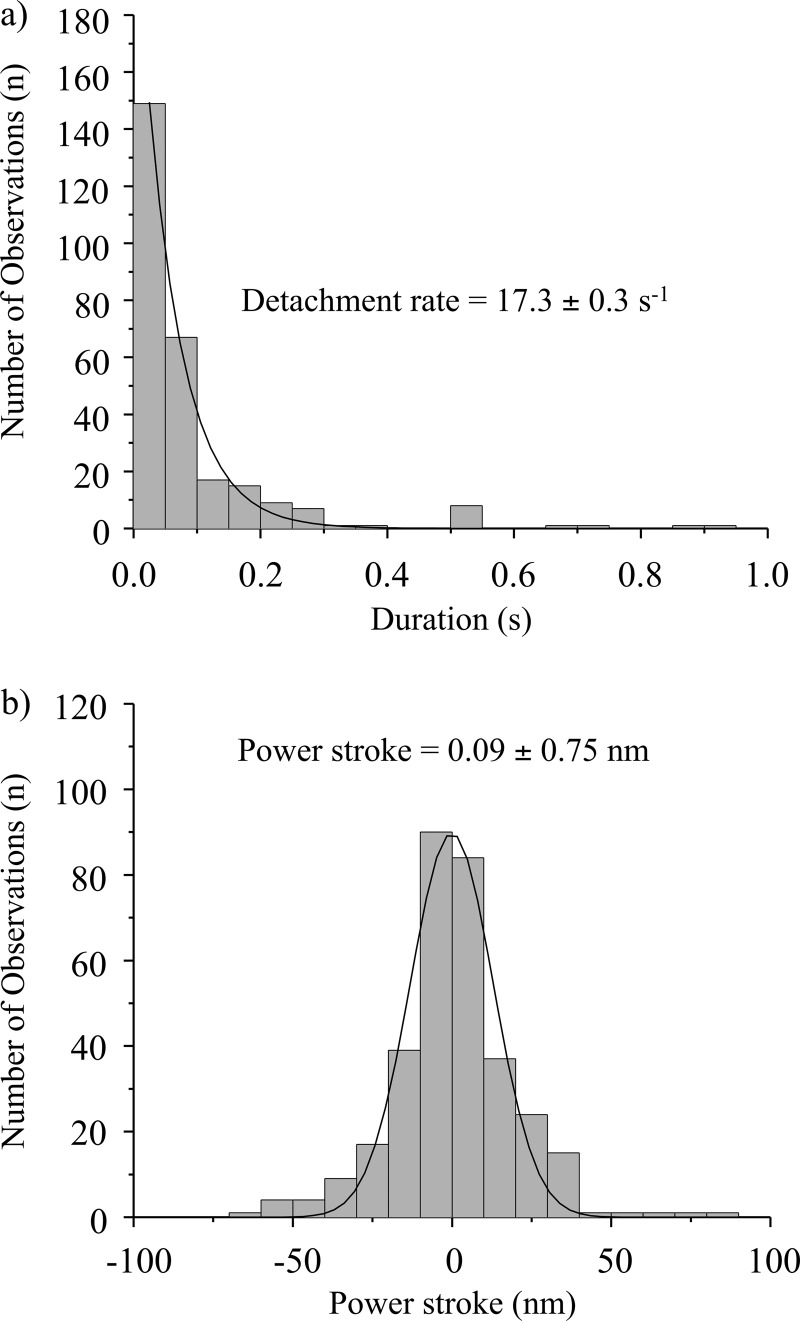
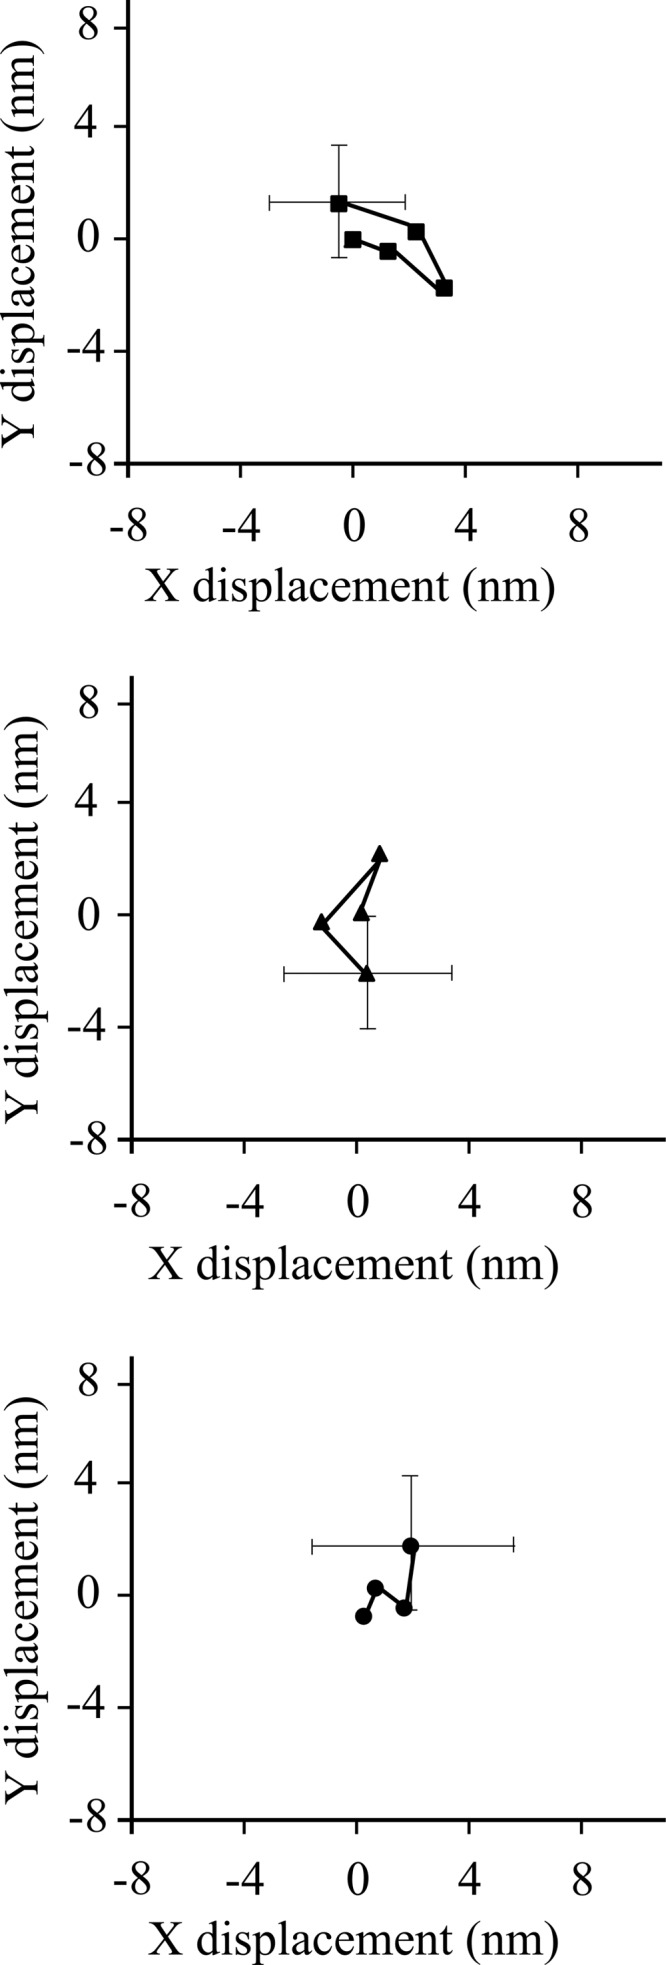
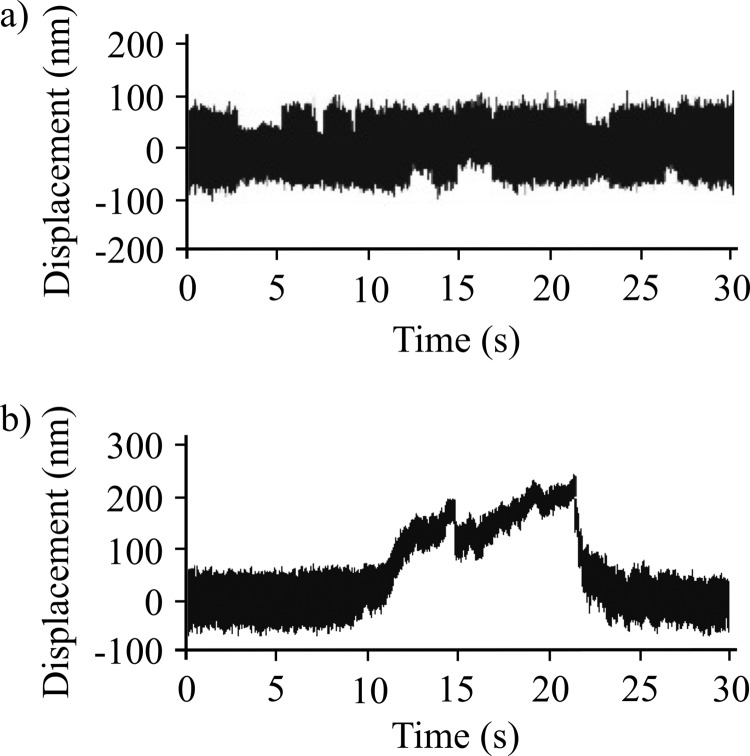
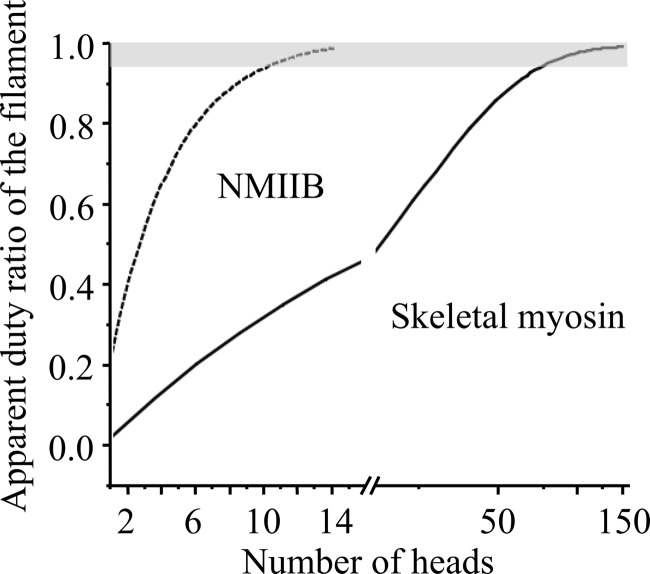
Nonmuscle myosin IIB (NMIIB) is a cytoplasmic myosin, which plays an important role in cell motility by maintaining cortical tension. It forms bipolar thick filaments with ~14 myosin molecule dimers on each side of the bare zone. Our previous studies showed that the NMIIB is a moderately high duty ratio (~20-25%) motor. The ADP release step (~0.35 s(-1)) of NMIIB is only ~3 times faster than the rate-limiting phosphate release (0.13 ± 0.01 s(-1)). The aim of this study was to relate the known in vitro kinetic parameters to the results of single molecule experiments and to compare the kinetic and mechanical properties of single- and double-headed myosin fragments and nonmuscle IIB thick filaments. Examination of the kinetics of NMIIB interaction with actin at the single molecule level was accomplished using total internal reflection fluorescence (TIRF) with fluorescence imaging with 1-nm accuracy (FIONA) and dual-beam optical trapping. At a physiological ATP concentration (1 mm), the rate of detachment of the single-headed and double-headed molecules was similar (~0.4 s(-1)). Using optical tweezers we found that the power stroke sizes of single- and double-headed heavy meromyosin (HMM) were each ~6 nm. No signs of processive stepping at the single molecule level were observed in the case of NMIIB-HMM in optical tweezers or TIRF/in vitro motility experiments. In contrast, robust motility of individual fluorescently labeled thick filaments of full-length NMIIB was observed on actin filaments. Our results are in good agreement with the previous steady-state and transient kinetic studies and show that the individual nonprocessive nonmuscle myosin IIB molecules form a highly processive unit when polymerized into filaments.


Figures

FIGURE 1.
FIGURE 1.
Purified proteins used in the study. a, Coomassie Blue-stained 4–12% SDS-polyacrylamide gel image of the samples. Lane 1, molecular mass standards. Lane 2, single-headed NMIIB-HMM-GFP. The ∼51-kDa fragment is the His-tagged S2-GFP. Lane 3, NMIIB-HMM-GFP. Lane 4, full-length NMIIB with GFP-RLC. The ∼43-kDa fragment is the GFP-tagged RLC. b, acrylamide pendant Phos tag phosphate affinity SDS-PAGE image of a representative preparation of NMIIB-HMM molecules before (lane 1) and after (lane 2) MLCK treatment. Densitometry analysis shows that 80% of RLCs were monophosphorylated (P-RLC), 12% were double-phosphorylated (PP-RLC), and 8% were not phosphorylated (RLC). c, rotary shadowed electron micrographs of the NMIIB constructs (upper) and simplified schematic diagrams of the molecules (lower). Scale bars: SH-HMM-GFP and HMM-GFP, 50 nm; full-length NMIIB filament with GFP-RLC, 100 nm.
FIGURE 2.
FIGURE 2.
TIRF microscopy analysis of actin-myosin interactions. a, histogram of dwell times of NMIIB-HMM-actin interactions at 1 mm ATP. Solid line is the single exponential fit to the data which gave a detachment rate constant of 0.37 ± 0.01 s−1, n = 611. b, histogram of dwell times of NMIIB-SH-HMM-actin interactions at 1 mm ATP. Solid line is the single exponential fit to the data which gave a detachment rate constant of 0.40 ± 0.02 s−1, n = 683. c, filament of full-length NMIIB molecule with GFP-RLC (green) interactions with rhodamine phalloidin-labeled actin (red), at 1 mm ATP (left panels). Right panels, GFP-labeled nonmuscle filament moving processively along a single actin filament. Scale bar, 1 μm. d, electron micrographs of NMIIB nonmuscle filaments interacting with actin filaments in the presence of ATP. Scale bars, 100 nm. e, histogram of dwell times of NMIIB filament-actin interactions at 1 mm ATP. Solid line is the single exponential fit to the data which gave a detachment rate constant of 0.016 ± 0.003 s−1, n = 62. f, distribution of run lengths of NMIIB filaments on actin filaments at 1 mm ATP. Solid line is the single exponential fit to the data which gave a run length of 3.8 ± 0.6 μm, n = 56.
FIGURE 3.
FIGURE 3.
Myosin-actin interactions at 1 mm ATP sampled at 20,000 Hz and filtered to 2000 Hz. a, NMIIB-HMM-actin interactions at 1 mm ATP. Top trace, bead position record. Bottom trace, variance. The white lines in the top trace represent the unitary actin-myosin interactions. b, NMIIB-SH-HMM-actin interactions at 1 mm ATP. Top trace, bead position record. Bottom trace, variance. The white lines in the top trace represent unitary actin-myosin interactions. c, histogram of dwell times of NMIIB-HMM-actin interactions at 1 mm ATP (0.37 ± 0.01 s−1, n = 327). Solid line shows the single exponential fit of the data. Inset shows data collected over a longer time frame. d, histogram of dwell times of NMIIB-SH-HMM-actin interactions at 1 mm ATP (0.34 ± 0.2 s−1, n = 371). Solid line shows the single exponential fit of the data. Inset shows data collected over a longer time frame. e, power stroke size of NMIIB-HMM. Fitting the displacement data collected from the optical trap during each acto-myosin interaction to a gaussian distribution (solid line) yielded histograms centered at 6.9 ± 1.2 nm, n = 257. f, power stroke size of NMIIB-SH-HMM) molecules. Fitting the displacement data collected from the optical trap during each acto-myosin interaction to a gaussian distribution yielded a histogram centered at 4.8 ± 1.3, n = 197.
FIGURE 4.
FIGURE 4.
Short lived acto-myosin interactions are observed in the raw bead position traces. a, NMIIB-HMM-actin interactions at 1 mm ATP. Top trace, bead position record. Bottom trace, variance. b, NMIIB-SH-HMM-actin interactions at 1 mm ATP. Top trace, bead position record. Bottom trace, variance. Arrows underneath the variance traces for a and b show short lived interactions; the arrowhead marks the position of a single longer lived interaction in these traces such as observed in Fig. 3, a and b. Note the difference in time scale for these data compared with those shown in Fig. 3. c, histogram of dwell times of fast actin-myosin interactions for NMIIB-HMM-actin interactions at 1 mm ATP. Solid line is a single exponential fit of the data which gave a detachment rate constant of 14.3 ± 0.5 s−1, n = 336. d, histogram of dwell times of fast actin-myosin interactions for NMIIB-SH-HMM-actin interactions at 1 mm ATP. Solid line is a single exponential fit of the data which gave a detachment rate constant of 17.2 ± 0.6 s−1, n = 459. e, power stroke sizes of NMIIB-HMM. f, power stroke sizes of SH-NMIIB-HMM. Fitting the displacement data collected from the optical trap during each acto-myosin interaction to gaussian distributions yielded histograms centered at ∼0 nm for both NMIIB-HMM (n = 440) and SH-HMM (n = 579) molecules.
FIGURE 5.
FIGURE 5.
Unphosphorylated NMIIB-HMM shows short lived interactions with actin. a, histogram of dwell times. Solid line shows a single exponential fit to the data which yield a detachment rate constant of 17.3 ± 0.3 s−1, n = 326. b, power stroke size distribution. Solid line shows a gaussian fit to the data which had a peak at 0.09 ± 0.75 nm, n = 338.
FIGURE 6.
FIGURE 6.
Displacement of HMM molecules in TIRF assay analyzed by FIONA. The positions of three molecules at 2-s intervals are shown. Error bars show the uncertainty of the measurements.
FIGURE 7.
FIGURE 7.
Optical trap analysis of NMIIB nonmuscle filament-actin interactions. a, bead position record of full-length NMIIB-actin interaction. In this case the myosin molecules were deposited on nitrocellulose surface in high salt (300 mm KCl AB buffer) buffer, and as a result single, two-headed myosin molecules are probed. No signs of processive runs were observed. b, bead position record of a NMIIB filament-actin interaction. Prior to sample deposition the ionic strength of the buffer was lowered to 150 mm, and as a result the myosin molecules formed filaments. The fluorescent GFP-RLC-labeled NMIIB filaments were clearly visible on top of the pedestals, and during the measurements these pedestals were targeted. The NMIIB filaments show robust motility.
FIGURE 8.
FIGURE 8.
Dependence of the duty ratio on number of myosin heads for skeletal muscle and NMIIB. In case of NMIIB (duty ratio is ∼0.22) the system reaches the processive zone (depicted in gray) when the number of available heads is ∼12–13. In case of skeletal myosin (duty ratio is 0.04) this number is 1 order of magnitude higher.

Similar articles

Cited by

References

    1. Odronitz F., Kollmar M. (2007) Drawing the tree of eukaryotic life based on the analysis of 2,269 manually annotated myosins from 328 species. Genome Biol. 8, R196. - PMC - PubMed
    1. de la Fuente H., Mittelbrunn M., Sánchez-Martín L., Vicente-Manzanares M., Lamana A., Pardi R., Cabañas C., Sánchez-Madrid F. (2005) Synaptic clusters of MHC class II molecules induced on DCs by adhesion molecule-mediated initial T-cell scanning. Mol. Biol. Cell 16, 3314–3322 - PMC - PubMed
    1. Lo C. M., Buxton D. B., Chua G. C., Dembo M., Adelstein R. S., Wang Y. L. (2004) Nonmuscle myosin IIb is involved in the guidance of fibroblast migration. Mol. Biol. Cell 15, 982–989 - PMC - PubMed
    1. Betapudi V., Licate L. S., Egelhoff T. T. (2006) Distinct roles of nonmuscle myosin II isoforms in the regulation of MDA-MB-231 breast cancer cell spreading and migration. Cancer Res. 66, 4725–4733 - PubMed
    1. Vicente-Manzanares M., Zareno J., Whitmore L., Choi C. K., Horwitz A. F. (2007) Regulation of protrusion, adhesion dynamics, and polarity by myosins IIA and IIB in migrating cells. J. Cell Biol. 176, 573–580 - PMC - PubMed

Publication types

LinkOut - more resources