. 2012 Nov 19;209(12):2215-28.
doi: 10.1084/jem.20121061. Epub 2012 Nov 12.

Nucleoside salvage pathway kinases regulate hematopoiesis by linking nucleotide metabolism with replication stress

Affiliations

Nucleoside salvage pathway kinases regulate hematopoiesis by linking nucleotide metabolism with replication stress

Wayne R Austin et al. J Exp Med. .

Abstract

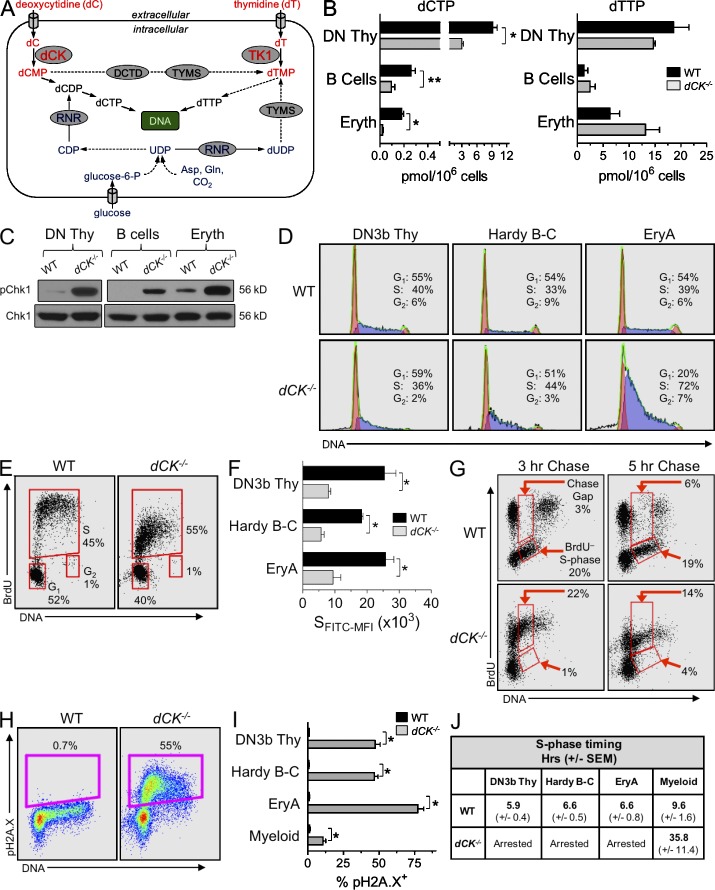
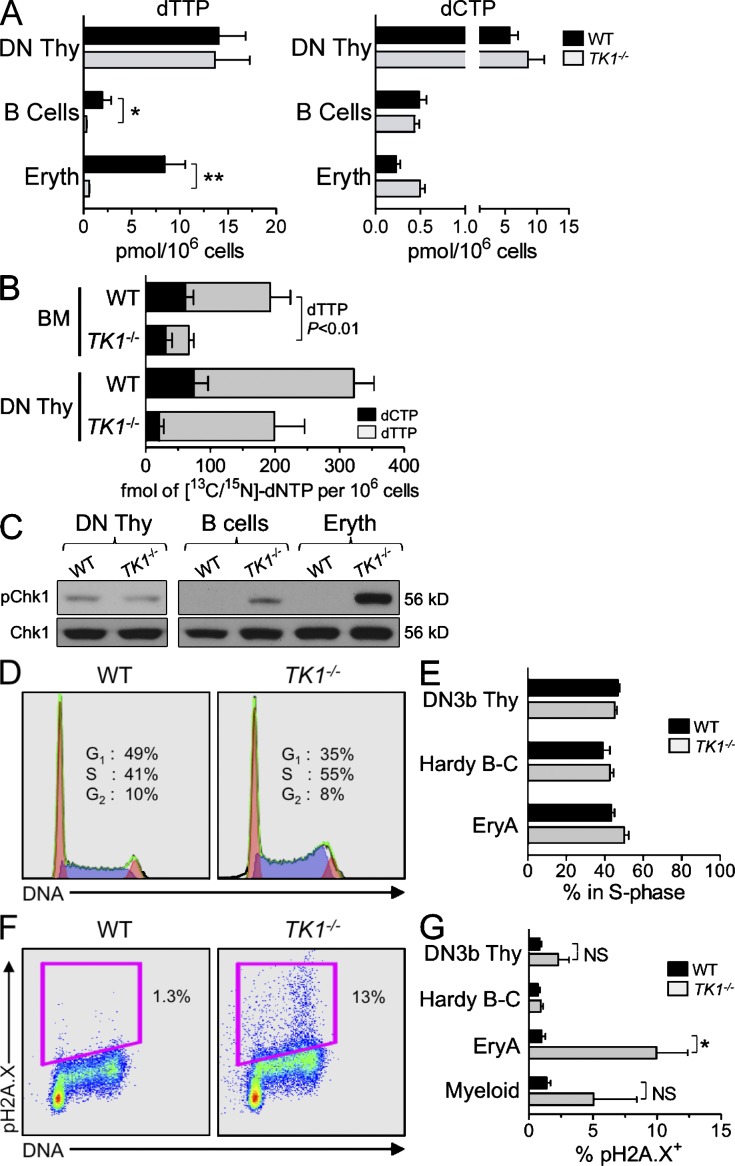
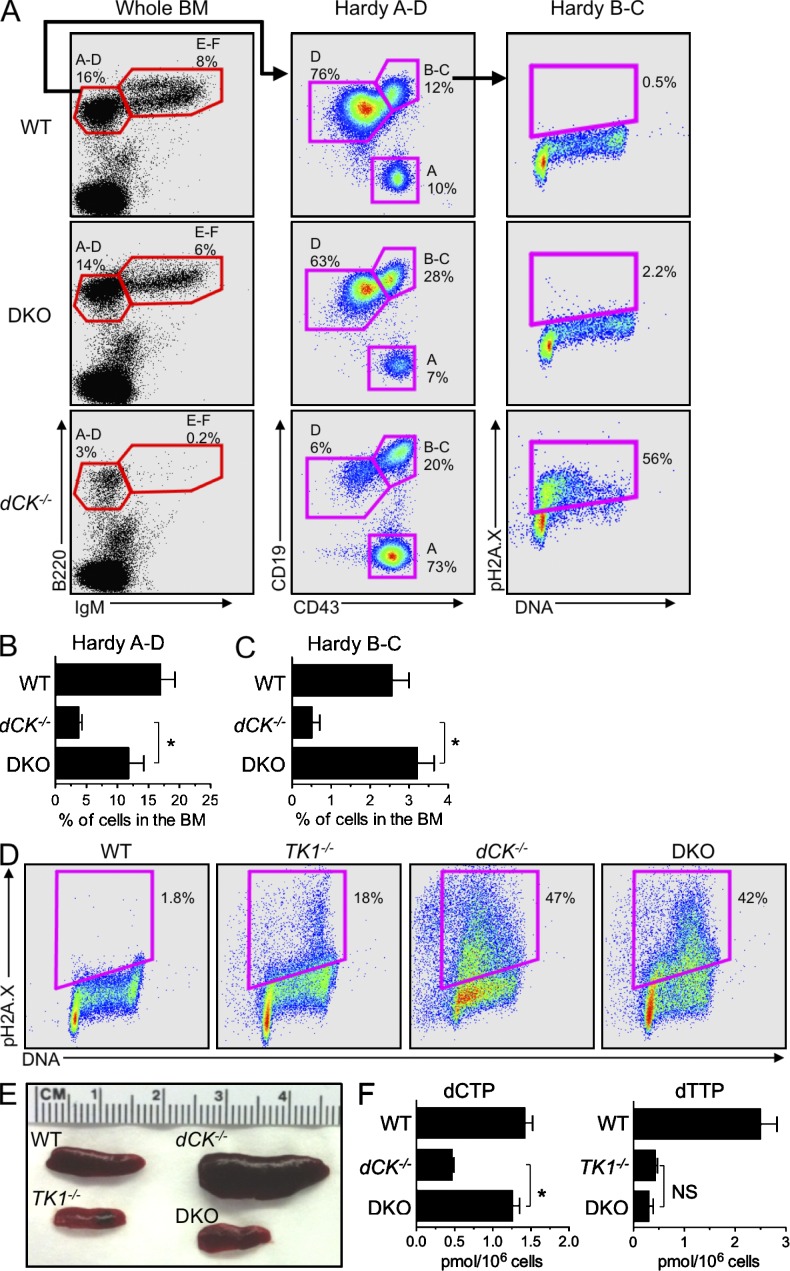
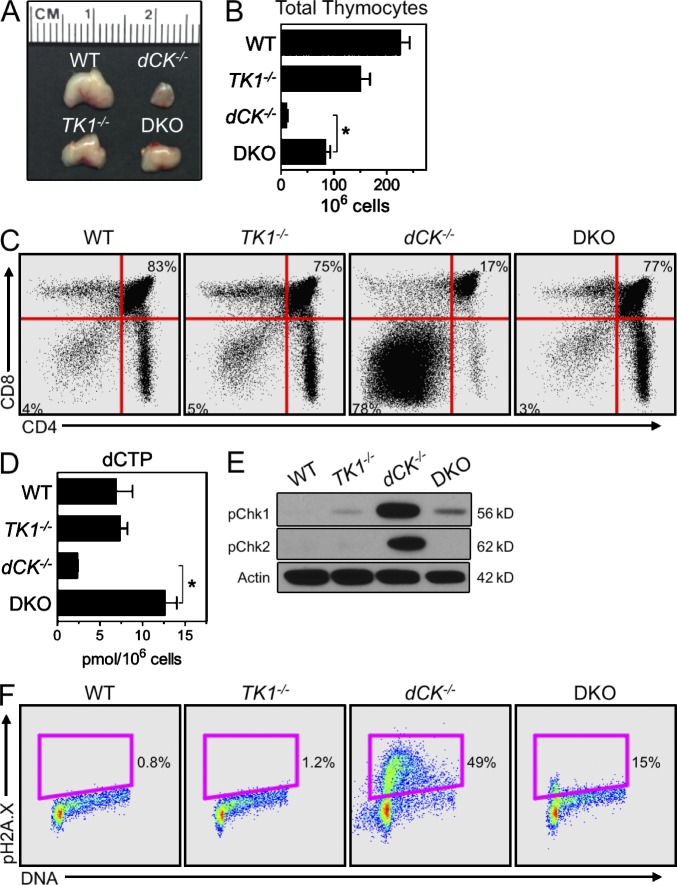
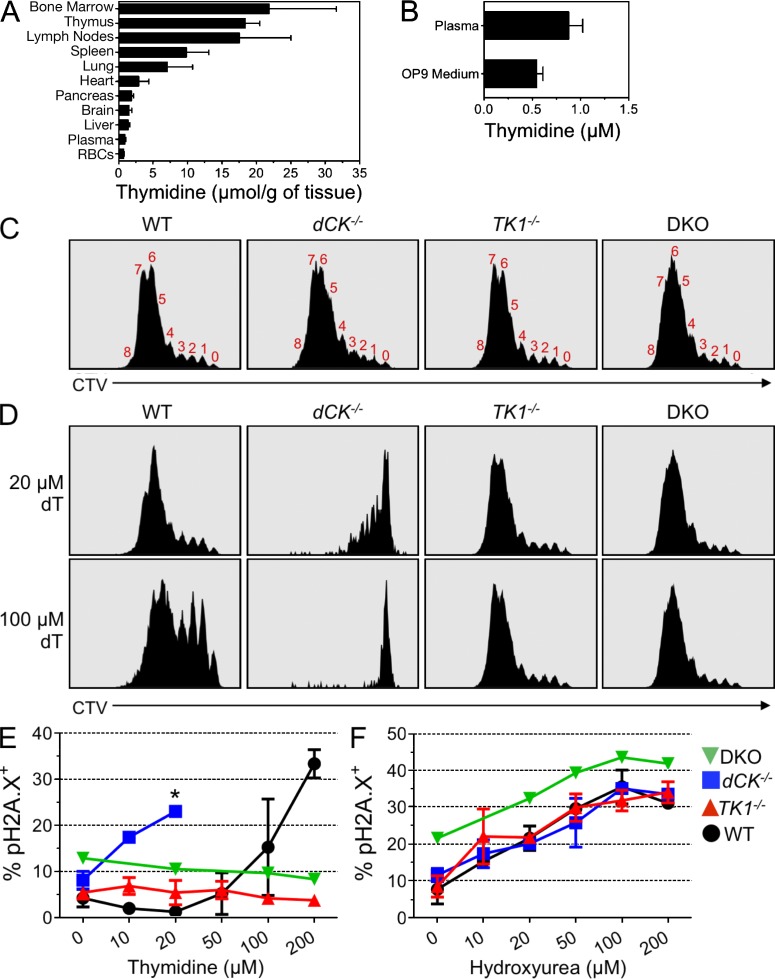
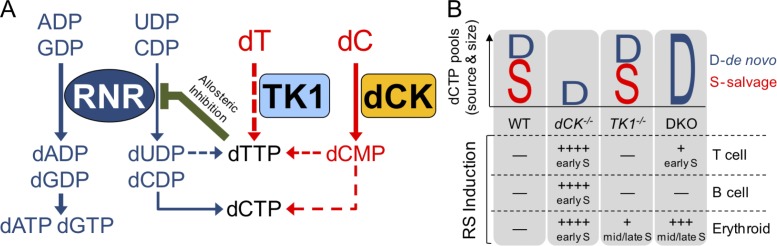
Nucleotide deficiency causes replication stress (RS) and DNA damage in dividing cells. How nucleotide metabolism is regulated in vivo to prevent these deleterious effects remains unknown. In this study, we investigate a functional link between nucleotide deficiency, RS, and the nucleoside salvage pathway (NSP) enzymes deoxycytidine kinase (dCK) and thymidine kinase (TK1). We show that inactivation of dCK in mice depletes deoxycytidine triphosphate (dCTP) pools and induces RS, early S-phase arrest, and DNA damage in erythroid, B lymphoid, and T lymphoid lineages. TK1(-/-) erythroid and B lymphoid lineages also experience nucleotide deficiency but, unlike their dCK(-/-) counterparts, they still sustain DNA replication. Intriguingly, dCTP pool depletion, RS, and hematopoietic defects induced by dCK inactivation are almost completely reversed in a newly generated dCK/TK1 double-knockout (DKO) mouse model. Using NSP-deficient DKO hematopoietic cells, we identify a previously unrecognized biological activity of endogenous thymidine as a strong inducer of RS in vivo through TK1-mediated dCTP pool depletion. We propose a model that explains how TK1 and dCK "tune" dCTP pools to both trigger and resolve RS in vivo. This new model may be exploited therapeutically to induce synthetic sickness/lethality in hematological malignancies, and possibly in other cancers.


Figures

Figure 1.
Figure 1.
dCK inactivation causes severe RS in lymphoid and erythroid lineages. (A) Schematic of the de novo pathway (blue) and of the nucleoside salvage pathway (NSP, red) inputs into pyrimidine dNTP pools for DNA synthesis. Solid arrows indicate single-step processes; dashed arrows indicate multistep processes with intermediates not named/depicted in the schematic. Gln, glutamine; Asp, aspartate; UDP, uridine diphosphate; CDP, cytidine disphosphate; TYMS, thymidylate synthase; DCTD, dCMP deaminase; dCK, deoxycytidine kinase; TK1, thymidine kinase 1. (B) dCTP and dTTP pools in WT (black bars) and dCK−/− (gray bars) cells; DN Thy, CD4/CD8 double-negative thymocytes; B cells, BM-resident B cell progenitors; Eryth, BM-resident erythroid progenitors. Data are mean values ±SEM for three independent measurements generated from four pooled mice per genotype during each independent measurement. *, P < 0.003; **, P < 0.02. (C) Western blot detection of pChk1 (phosphorylated on Ser345) in lysates from lymphoid and erythroid progenitors. Total CHK1 protein was used as a loading control. (D) Representative examples of total DNA content staining and percentage of cells in the G1, S, and G2/M phases in WT and dCK−/− DN3b thymocytes, Hardy fraction B-C cells, and EryA cells. (E) Representative BrdU incorporation into WT and dCK−/− DN3b thymocytes 1 h after injection of BrdU. Percent of cells in G1, S, and G2 phases of the cell cycle are indicated. (F) Anti-BrdU FITC mean fluorescent intensities of S-phase cells (SFITC-MFI) from WT and dCK−/− DN3b thymocytes, Hardy fraction B-C cells, and EryA cells. Data are mean values ±SEM. n = 4 mice/genotype; *, P < 0.01. (G) Representative BrdU detection in WT and dCK−/− DN3b thymocytes after 3 and 5 h of BrdU chase (n = 4 mice/genotype). Percentages of cells present in chase gap and BrdU S-phase gates are indicated. (H) Detection of H2A.X phosphorylated on Ser139 (pH2A.X) in DN3b thymocytes by flow cytometry. Percentages of pH2A.X-positive (pH2A.X+) cells are indicated. (I) Quantification of pH2A.X-positive staining in DN3b thymocytes, Hardy B-C cells, and EryA cells from WT (black bars) and dCK−/− (gray bars) mice. n = 7 mice/genotype; *, P < 0.0001. (J) S-phase durations, in hours, calculated using 5-h BrdU chase conditions in DN3b thymocytes, Hardy B-C cells, EryA cells, and BM-resident myeloid cells (CD11b+) from WT and dCK−/− mice. Data are mean values in hours ±SEM. n = 4 mice/genotype.
Figure 2.
Figure 2.
TK1 inactivation causes only minor RS in hematopoietic cells. (A) dTTP and dCTP pools from WT (black bars) and TK1−/− (gray bars) DN Thymocytes, BM-resident B cell progenitors, and BM-resident erythroid progenitors. Data are mean values ±SEM for three independent measurements. n = 4 mice/genotype/replicate; *, P < 0.005; **, P = 0.0001. (B) Concentrations (fmol per 106 cells) of [13C/15N]-dCTP (black bars) and [13C/15N]-dTTP pools (gray bars) from WT and TK1−/−-nucleated BM cells and DN thymocytes. Data are means ±SEM from n = 5 (WT) and n = 4 (TK1−/−) mice from two independent experiments. (C) Western blot detection of pChk1 in lysates from lymphoid and erythroid progenitors. Total CHK1 protein was used as a loading control. (D) Representative example of total DNA content staining in EryA cells from WT and TK1−/− cells, and (E) quantification of percentage of DN3b thymocytes, Hardy B-C cell, and EryA cells in S-phase as determined by total DNA content staining. Data are mean values ±SEM. n = 3 mice/genotype. (F) Representative example of pH2A.X detection in WT and TK1−/− EryA cells. (G) Quantification of pH2A.X-positive staining in DN3b thymocytes, Hardy B-C cell, EryA cells from WT (black bars), and TK1−/− (gray bars) mice. n = 4 mice/genotype. NS, P > 0.05; *, P < 0.03.
Figure 3.
Figure 3.
TK1 inactivation relieves the early S-phase RS in dCK−/− developing B and erythroid cells. (A) Representative examples of B cell development staining of BM samples from WT, dCK−/−, and dCK−/−;TK1−/− DKO mice. IgM and B220 staining of whole BM cells identify Hardy fraction A-D (B220+, IgM) and Hardy fraction E-F (B220+, IgM+) populations. Hardy fraction A-D cells are sub-gated using CD43 and CD19 expression to identify Hardy Fraction A (CD43hi, CD19), B-C (CD43hi, CD19+), and D (CD43lo, CD19+). Hardy fraction B-C cells are then analyzed for cell cycle position and pH2A.X expression. Plots are representative of n = 3 mice/genotype. (B and C) Quantification of percentage of total BM cells that are phenotypically Hardy fraction A-D (B), and Hardy fraction B-C (C) populations from WT, dCK−/−, and DKO mice. Data are mean values ±SEM for n = 3/genotype; *, P < 0.04; **, P < 0.01. (D) Representative examples of pH2A.X detection in EryA cells from WT, dCK−/−, TK1−/−, and DKO mice. n = 4 mice/genotype. (E) Representative images of spleens from WT, dCK−/−, TK1−/−, and DKO mice. (F) dCTP and dTTP pool measurements from nucleated BM cells from WT, dCK−/−, TK1−/−, DKO mice. Data are mean values ±SEM. n = 4 mice/genotype. *, P < 0.001.
Figure 4.
Figure 4.
TK1 inactivation normalizes the development of dCK−/− T cells. (A and B) Gross thymus size (A), and total viable thymocytes recovered (B), from WT, dCK−/−, TK1−/−, and DKO mice. Data are mean values ±SEM. n = 5 mice/genotype; *, P < 0.001. (C) Representative example of CD4 and CD8 staining of total thymocytes from WT, dCK−/−, TK1−/−, and DKO mice. Percentages of DN thymocytes (bottom left gate) and DP thymocytes (top right gate) are indicated. (D) Measurements of dCTP pools in DN thymocytes isolated from WT, dCK−/−, TK1−/−, and DKO mice. Data are mean values ±SEM. n = 2 mice/genotype; *, P < 0.01. (E) Western blot detection of pChk1 and Chk2 phosphorylated on Thr68 (pChk2) in DN thymocytes. Actin was used as a loading control. (F) Representative examples of pH2A.X detection in DN3b thymocytes from WT, dCK−/−, TK1−/−, and DKO mice.
Figure 5.
Figure 5.
Thymidine induces RS in cultured dCK−/− thymocytes. (A) Relative thymidine abundance in various tissues from C57BL/6 mice as determined by LC-MS/MS. Concentrations given in μmol/g of whole tissue. Data are means ±SEM; n = 5/tissue type. (B) Concentrations of thymidine (in μM) from C57BL/6 plasma and from standard OP9-DL1 culture medium, as determined by LC-MS/MS. Data are means ±SEM; Plasma, n = 7; Media, n = 3. (C) Representative CellTrace Violet (CTV) dye dilution curves from WT, dCK−/−, TK1−/−, and DKO DN3a thymocytes cultured on OP9-DL1 stroma for 4 d without thymidine supplementation in the medium. Red numbers above the distinct CTV peaks reflect the total number of completed cell divisions executed by the thymocyte populations. WT, dCK−/−, and TK1−/−, n = 4; DKO, n = 1. (D) CTV dye dilution curves after 4 d of culturing in the presence of 20 and 100 µM thymidine added to the culture medium. WT, dCK−/−, and TK1−/−, n = 4; DKO, n = 1. (E) Percent of live cells that are pH2A.X positive in WT (black circles), dCK−/− (blue squares), TK1−/− (red up triangles), and DKO (green down triangles) DN3b thymocytes after 48 h of stimulation in increasing concentrations of thymidine. WT, dCK−/−, and TK1−/−, n = 2; DKO, n = 1. *, Cessation of measurements of pH2A.X levels caused by massive cell death (>80% sub-G1 staining; not depicted) induced by exposure of dCK−/− cells to concentrations of thymidine equal to or greater than 50 µM. (F) pH2A.X expression in WT, dCK−/−, TK1−/−, and DKO DN3b thymocytes after 12 h of exposure to increasing concentrations of hydroxyurea 36 h after plating on OP9-DL1 stroma. WT, dCK−/−, and TK1−/−, n = 2; DKO, n = 1.
Figure 6.
Figure 6.
Deoxyribonucleoside salvage kinases induce and resolve RS during hematopoiesis. (A) Under normal conditions, the RNR complex reduces purine ribonucleotide diphosphates (ADP and GDP) and pyrimidine ribonucleotide diphosphates (CDP and UDP) to contribute to dNTP pools (dATP, dGTP, dTTP, and dCTP). Although in hematopoietic cells RNR appears to be solely responsible for producing purine dNTP pools, the majority of dTTP pools are produced from salvaged thymidine, which is present in abundant amounts in thymus and BM. dCK may also contribute to dTTP pools as shown in Fig. 1 A and Fig. 2 C. Elevated dTTP levels prevent RNR from reducing CDP to dCDP and possibly UDP to dUDP via allosteric inhibition. To maintain dCTP pools, rapidly dividing hematopoietic cells rely on deoxycytidine salvage via dCK. (B) Graphical representation of the source (D-de novo, S-salvage) and size (height of D or S) of dCTP pools in various hematopoietic lineages. In the absence of dCK activity (dCK−/− column), dCTP pools become insufficient, leading to severe RS (++++) and DNA synthesis arrest in early S-phase in T cell, B cell, and erythroid cell precursors. In the absence of TK1 activity (TK1−/− column), dCTP pools are unaffected and only mild RS (+) occurs in late S-phase in erythroid precursors. The mild RS may be caused by an imbalanced dUTP/dTTP ratio in the absence of TK1. When both dCK and TK1 are inactivated (DKO column), de novo dCDP production is de-repressed and, subsequently, dCTP pools are restored to WT levels. DKO thymocytes have measurable, but overall mild, levels of RS (+) in early S-phase. The absence of NSP is well tolerated by B cell precursors, but it results in severe late S-phase RS (+++) in erythroid precursors.

References

    1. Arlt M.F., Ozdemir A.C., Birkeland S.R., Wilson T.E., Glover T.W. 2011. Hydroxyurea induces de novo copy number variants in human cells. Proc. Natl. Acad. Sci. USA. 108:17360–17365 10.1073/pnas.1109272108 - DOI - PMC - PubMed
    1. Arnér E.S., Eriksson S. 1995. Mammalian deoxyribonucleoside kinases. Pharmacol. Ther. 67:155–186 10.1016/0163-7258(95)00015-9 - DOI - PubMed
    1. Begg A.C., McNally N.J., Shrieve D.C., Kärcher H. 1985. A method to measure the duration of DNA synthesis and the potential doubling time from a single sample. Cytometry. 6:620–626 10.1002/cyto.990060618 - DOI - PubMed
    1. Bester A.C., Roniger M., Oren Y.S., Im M.M., Sarni D., Chaoat M., Bensimon A., Zamir G., Shewach D.S., Kerem B. 2011. Nucleotide deficiency promotes genomic instability in early stages of cancer development. Cell. 145:435–446 10.1016/j.cell.2011.03.044 - DOI - PMC - PubMed
    1. Bjursell G., Reichard P. 1973. Effects of thymidine on deoxyribonucleoside triphosphate pools and deoxyribonucleic acid synthesis in Chinese hamster ovary cells. J. Biol. Chem. 248:3904–3909 - PubMed

Publication types

MeSH terms