. 2012 Nov 19;209(12):2165-81.
doi: 10.1084/jem.20121090. Epub 2012 Nov 12.

A novel role of sphingosine 1-phosphate receptor S1pr1 in mouse thrombopoiesis

Affiliations

A novel role of sphingosine 1-phosphate receptor S1pr1 in mouse thrombopoiesis

Lin Zhang et al. J Exp Med. .

Abstract

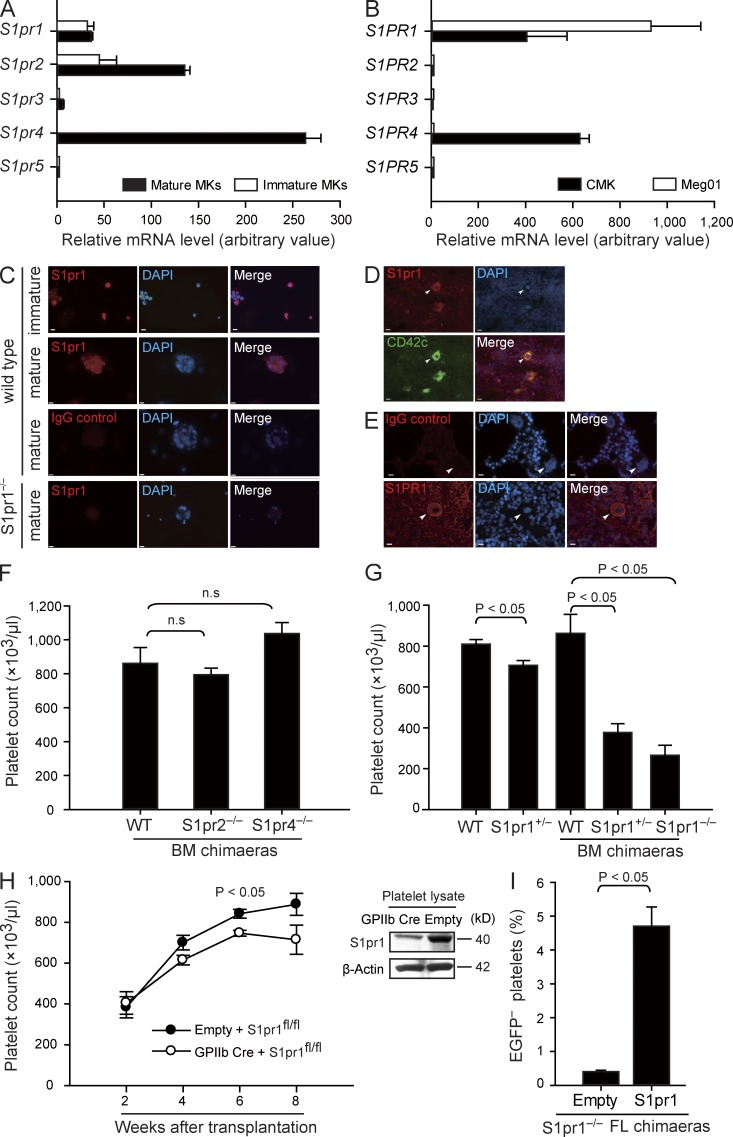
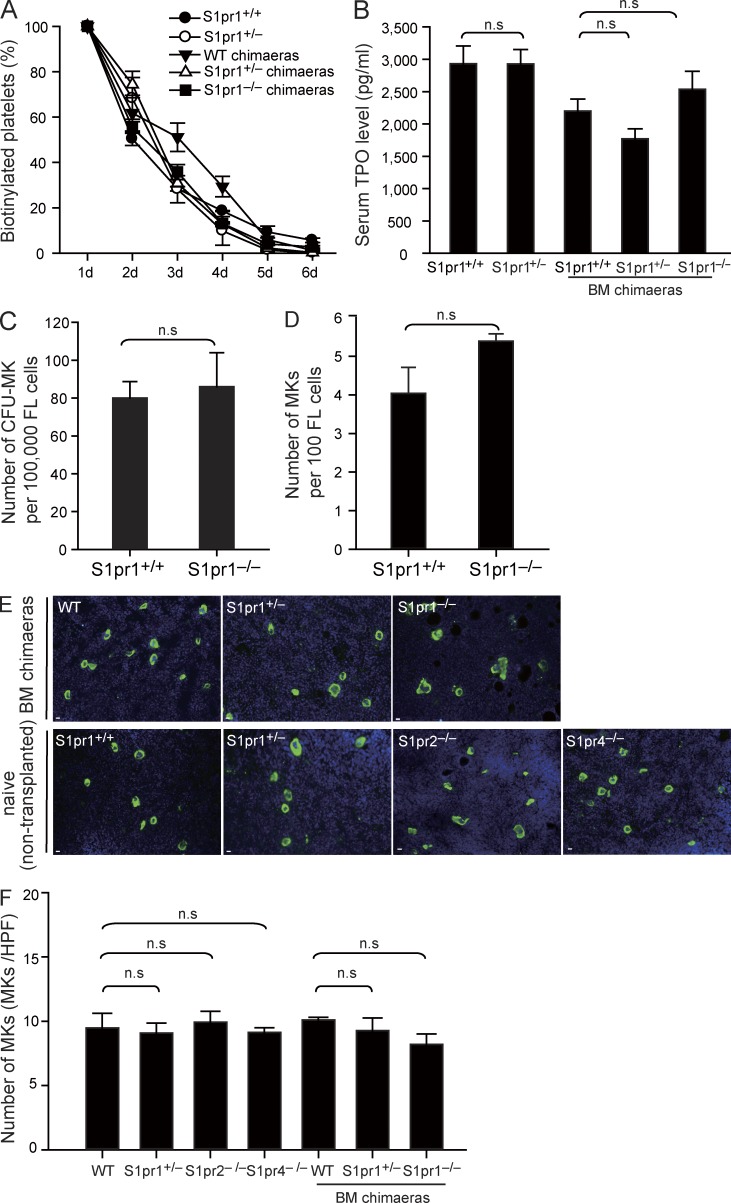
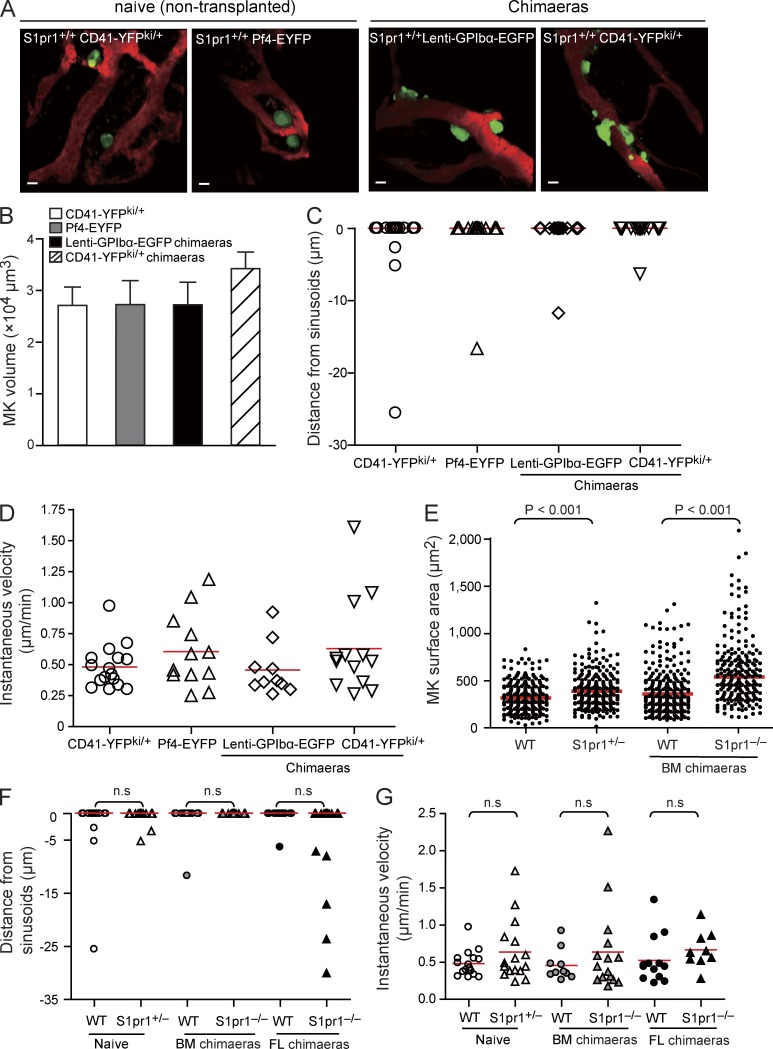
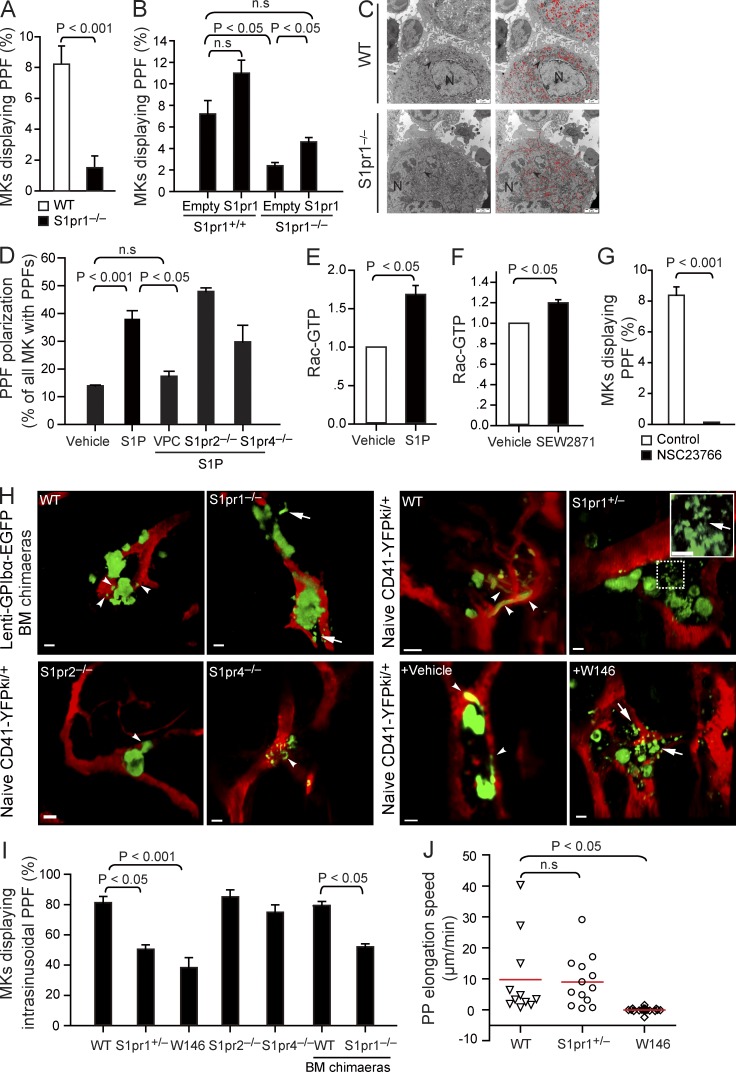
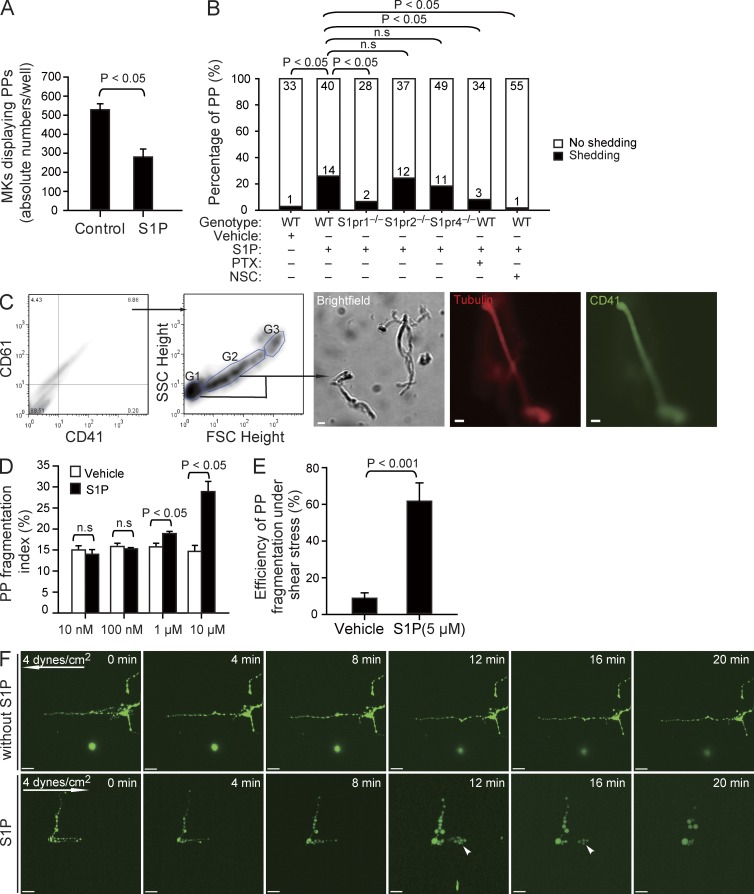
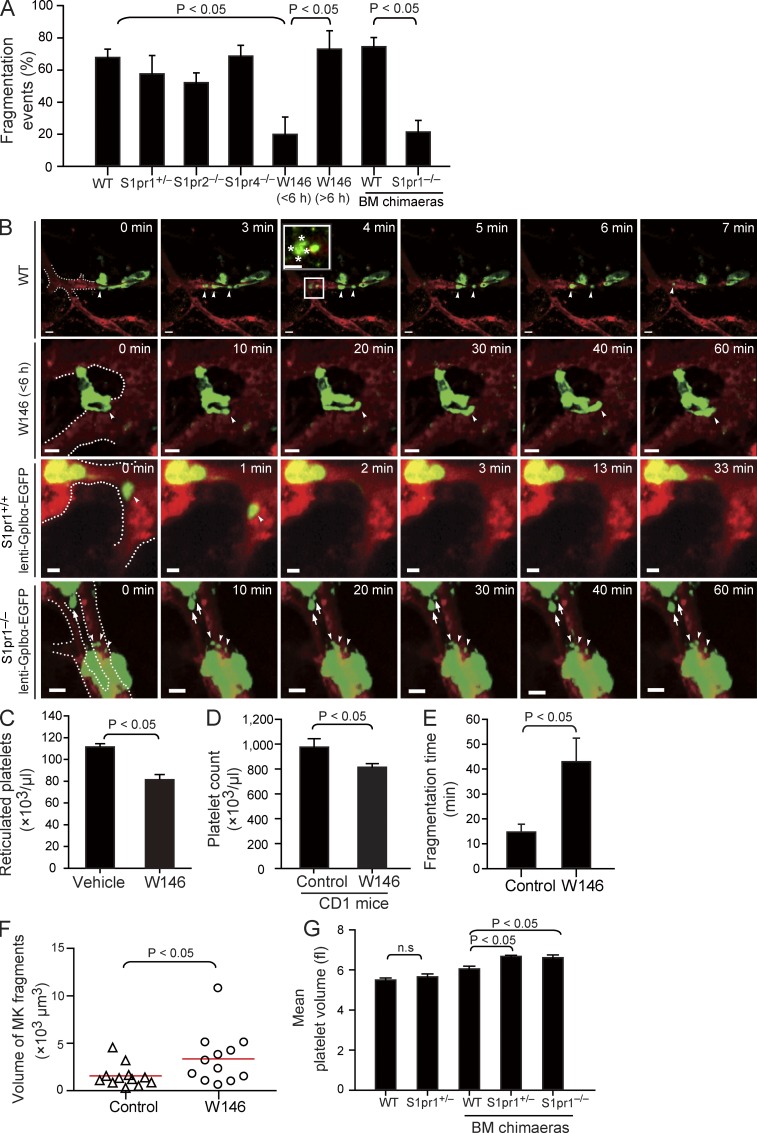
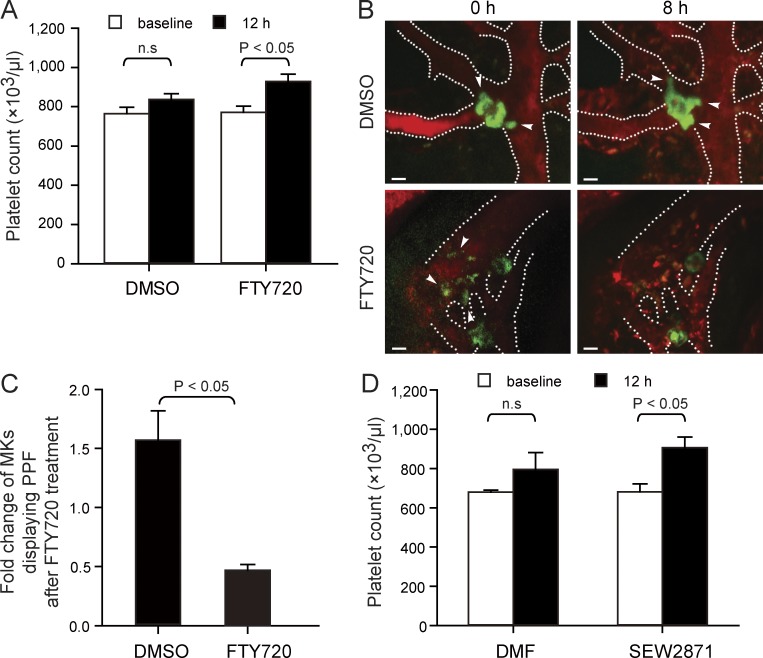
Millions of platelets are produced each hour by bone marrow (BM) megakaryocytes (MKs). MKs extend transendothelial proplatelet (PP) extensions into BM sinusoids and shed new platelets into the blood. The mechanisms that control platelet generation remain incompletely understood. Using conditional mutants and intravital multiphoton microscopy, we show here that the lipid mediator sphingosine 1-phosphate (S1P) serves as a critical directional cue guiding the elongation of megakaryocytic PP extensions from the interstitium into BM sinusoids and triggering the subsequent shedding of PPs into the blood. Correspondingly, mice lacking the S1P receptor S1pr1 develop severe thrombocytopenia caused by both formation of aberrant extravascular PPs and defective intravascular PP shedding. In contrast, activation of S1pr1 signaling leads to the prompt release of new platelets into the circulating blood. Collectively, our findings uncover a novel function of the S1P-S1pr1 axis as master regulator of efficient thrombopoiesis and might raise new therapeutic options for patients with thrombocytopenia.


Figures

Figure 1.
Figure 1.
MKs express S1pr1, and S1pr1-deficient mice display severe thrombocytopenia. (A) Relative expression of S1P receptor mRNA by FL-derived mature and immature MKs. (B) Relative expression of S1P receptor mRNA in human megakaryocytic cell lines. (A and B) Data are representative of three independent experiments with triplication. (C) Representative immunostaining of S1pr1 in immature and mature FL-derived MKs. WT MKs stained with irrelevant control IgG or anti-S1pr1–stained S1pr1-null MKs served as controls. (D and E) Expression of S1pr1 in murine BM (D) and S1PR1 in human BM sections (E). Arrowheads indicate MKs. CD42c is the marker for MKs. All MKs examined stained positive for S1pr1 or S1PR1. Bars, 10 µm. (F) Platelet counts in peripheral blood. n = 15 for WT BM chimaeras; n = 5 for S1pr2−/− BM chimaeras; n = 3 for S1pr4−/− BM chimaeras. (G) Platelet counts in peripheral blood. n = 8 for WT; n = 6 for S1pr1+/−; n = 15 for WT BM chimaeras; n = 9 for S1pr1+/− BM chimaeras; n = 14 for S1pr1−/− BM chimaeras. (H) Platelet counts in chimaeras after transferring S1pr1fl/fl BM cells transduced with lenti-GPIIb-cre or empty control vectors into irradiated recipient mice (left). Expression of S1pr1 in platelets in chimaeras after transferring S1pr1fl/fl BM cells transduced with lenti-GPIIb-cre or empty control vectors. β-Actin served as loading control (right). n = 3 per genotype. (I) Percentage of EGFP platelets in chimaeras after hematopoietic reconstitution of lethally irradiated mice with EGFP+ S1pr1+/+ BM cells and EGFP S1pr1−/− FL cells at a ratio of 20:1. The EGFP S1pr1−/− FL cells were transduced with lenti-GpIbα-S1pr1 or empty control vectors before transplantation. n = 3 per genotype. All error bars indicate SEM.
Figure 2.
Figure 2.
Loss of S1pr1 does not change platelet life span, serum TPO levels, and MK development. (A) Platelet life span assays in the indicated genotypes. n = 3–5 per genotype. (B) Serum TPO levels. n = 3–5 per genotype. (C) Quantification of CFU-MK numbers in FL cells. Data are representative of three independent experiments with triplication. (D) Number of mature MKs in cultured FL cells. Data are representative of four independent experiments with triplication. (E) Representative immunostaining of MKs in mouse femoral BM. MKs were detected by the MK-specific marker CD41 (green). DAPI is stained blue. Bars, 10 µm. (F) Quantification of MK numbers per 20× high-power field in femoral BM. n = 3 mice per genotype. All error bars represent SEM.
Figure 3.
Figure 3.
Loss of S1pr1 increases the size but has no effect on the positioning and motility of MKs in vivo. (A) Representative MP-IVM images of YFP+ or EGFP+ MKs (green) in BM. BM microvasculature was visualized by intravenous injection of TRITC-dextran (red). Left, naive (nontransplanted) S1pr1+/+CD41-YFPki/+; middle left, S1pr1+/+;Pf4-EYFP; middle right, S1pr1+/+;lenti-GPIbα-EGFP BM chimaeras; right, S1pr1+/+;CD41-YFPki/+ FL chimaeras. Bars, 20 µm. (B–D) Volumes (B), distances from sinusoids (C), and the instantaneous lateral (x-y) velocity (D) of MKs in the indicated groups. Red lines in C indicate medians; red lines in D indicate means. Error bars represent SEM. n = 13–46 MKs per genotype. Data are pooled from three mice each group. P-values among the different groups in B–D are >0.05. (E) Surface area of MKs in BM. (F) Distance of MKs from BM sinusoids. (E and F) Red lines indicate medians. (G) Instantaneous lateral (x-y) velocity of MKs. Red lines indicate means. (E–G) Data are pooled from three mice each group.
Figure 4.
Figure 4.
S1P regulates PPF. (A) The percentage of MKs displaying PPF. PPF is expressed as the percentage of MKs carrying PPs (8,000-10,000 MKs per experiment, five independent experiments with triplications). (B) The percentage of MKs displaying PPF in S1pr1+/+ or S1pr1−/− MKs transduced with lenti-GpIbα-S1pr1 or empty control vectors (3,000-8,000 MKs per experiment, two independent experiments with triplications). (C) Representative electron micrographs of WT and S1pr1−/− MKs in BM. Arrowheads indicate the DMS. Red color highlights the DMS. N, nucleus. (D) The percentage of MKs with polarized PPF in the presence or absence of S1P and the S1pr1-specific inhibitor VPC23019 (VPC). n = 127–265 MKs per group. Data are pooled from three to five independent experiments. (E) Y10/L8057 cells were incubated with 10 µM S1P or vehicle for 2 min. The activities of Rac-GTP were quantified by pull-down assay (n = 5 independent experiments). (F) Y10/L8057 cells were incubated with 1 µM S1pr1 agonist, SEW2871, or vehicle for 5 min. The activities of Rac-GTP were quantified by pull-down assay (n = 3 independent experiments). (G) The percentage of MKs displaying PPF in the presence or absence of 50 µM NSC23766, a Rac GTPase inhibitor (4,000-7,000 MKs per experiment; three independent experiments with triplications). (H) Representative MP-IVM images of MKs with YFP+ or EGFP+ PPs. Green indicates MKs and PPs; red indicates sinusoids. Arrowheads indicate extravascular YFP+ or EGFP+ PPs; arrows indicate interstitial YFP+ or EGFP+ PPs. The inset shows magnification for the dotted box. The arrow in the inset indicates the connection between extravascular YFP+ PPs. Bars: (C) 2 µm; (H) 20 µm. (I) MKs displaying intrasinusoidal PPF in vivo presented as a percentage of all MKs carrying PPs (20–30 MKs per group; five independent experiments for WT; three independent experiments for other genotypes). (J) The lateral (x-y) speed of PP elongation was measured in naive (nontransplanted) S1pr1+/+CD41-YFPki/+ mice, S1pr1+/−CD41-YFPki/+ mice, and S1pr1+/+CD41-YFPki/+ mice treated with W146. Red lines indicate means. Data are pooled from three mice each group. All error bars indicate SEM.
Figure 5.
Figure 5.
The effect of S1P on PP fragmentation in vitro. (A) The number of MKs displaying PPF in the absence or presence of 10 µM S1P (230–590 MKs per experiment; three independent experiments with triplications). (B) The number of PPs with or without fragmentation observed by DIC microscopy in vitro over 1 h in the indicated groups. Data are pooled from 4–10 independent experiments for each group (n = 30–60 per group). (C) Representative dot plots show flow cytometric analyses of PP fragmentation. The first two panels show the gates for PPs. The CD41+CD61+ population was analyzed for the distribution of PPs according to FSC and SSC. MKs are G3; PPs with higher and lower FSC values are G2 and G1, respectively. The three representative microphotographs in the right show a representative brightfield image, as well as tubulin and CD41 stainings of fragments sorted using the gating strategy illustrated in the two plots. (D) Flow cytometric analyses of the PP fragmentation index in the presence or absence of various concentrations of S1P. The PP fragmentation index was calculated as described in Materials and methods. Data are representative of six independent experiments with triplication. (E) PP fragmentation by MKs exposed to shear stress. The efficiency of dynamic PP fragmentation was calculated as described in Materials and methods. Data are pooled from five independent experiments for each group. (F) Representative time-lapse video microscopy of PPs in the presence or absence of 5 µM S1P under shear stress (4 dynes/cm2). Arrows indicate direction of flow; arrowheads indicate PP shedding events. All error bars indicate SEM. Bars: (C) 10 µm; (F) 20 µm.
Figure 6.
Figure 6.
The effect of S1P on PP fragmentation in vivo. (A) Percentage of PP fragmentation events observed by MP-IVM over 1 h in the indicated groups. n = 13–33 per group. Data are pooled from three to seven independent experiments. (B) Role of S1pr1 for PP shedding in vivo visualized by MP-IVM. Representative MP-IVM sequences show that WT MKs frequently shed PPs as shown in the first and the third rows. The inset shows a magnification of a shed PP particle. Asterisks show embedded platelet-like particles. Inhibition or loss of S1pr1 abolishes PP shedding (second and fourth rows). Arrowheads indicate intrasinusoidal PPs, and arrows show extrasinusoidal PPs in S1pr1−/− chimaeras. The dashed lines highlight the sinusoids. Green or yellow indicates MKs and PPs; red indicates sinusoids. Bars, 20 µm. (C) Circulating reticulated (young) platelets in mice treated with W146, an S1pr1-specific antagonist, or vehicle as assessed by flow cytometry. n = 3 mice each group. (D) Circulating platelet counts in CD1 mice treated with W146 or vehicle. n = 4 mice each group. (E) The time point of fragmentation detected by MP-IVM in mice treated with W146 (<6 h) or vehicle. Data are pooled from three independent experiments each group. (F) Volumes of PP fragments in mice treated with W146 (within 6 h) or vehicle. Red lines indicate means. Data are pooled from three independent experiments each group. (G) Mean platelet volume in the indicated genotypes. n = 8 for WT; n = 6 for S1pr1+/−; n = 15 for WT BM chimaeras; n = 9 for S1pr1+/− BM chimaeras; n = 14 for S1pr1−/− BM chimaeras. All values are mean and SEM.
Figure 7.
Figure 7.
The S1P analogue FTY720 and SEW2871 trigger rapid release of platelets. (A) Mice were treated with a single dose of FTY720 (3 mg/kg i.p.) or DMSO (vehicle). Open bars indicate baseline of platelet counts assessed before drug administration; closed bars indicate platelet counts measured 12 h after drug administration. n = 9 mice each group. (B) Representative MP-IVM images of MKs with YFP+ PPs from CD41-YFPki/+ mice before and 8 h after a single injection of FTY720 (3 mg/kg i.p.) or DMSO (vehicle). Green indicates MKs and PPs; red indicates sinusoids. Arrowheads indicate intravascular PPs. Dashed lines indicate BM sinusoidal vessels. Bars, 20 µm. (C) Fold change of MKs displaying PPF 8 h after a single injection of FTY720 (3 mg/kg i.p.) or DMSO (vehicle) compared with numbers recorded before treatment. n = 120–140 MKs per group. Data are pooled from three independent experiments. (D) Mice were treated with a single dose of SEW2871 (20 mg/kg i.p.) or dimethyl formamide (DMF; vehicle). Open bars indicate baseline of platelet counts assessed before drug administration; closed bars indicate platelet counts measured 12 h after drug administration. n = 3 mice each group. All error bars indicate SEM.

References

    1. Allende M.L., Yamashita T., Proia R.L. 2003. G-protein-coupled receptor S1P1 acts within endothelial cells to regulate vascular maturation. Blood. 102:3665–3667 10.1182/blood-2003-02-0460 - DOI - PubMed
    1. Allende M.L., Tuymetova G., Lee B.G., Bonifacino E., Wu Y.P., Proia R.L. 2010. S1P1 receptor directs the release of immature B cells from bone marrow into blood. J. Exp. Med. 207:1113–1124 10.1084/jem.20092210 - DOI - PMC - PubMed
    1. Aspenström P., Fransson A., Saras J. 2004. Rho GTPases have diverse effects on the organization of the actin filament system. Biochem. J. 377:327–337 10.1042/BJ20031041 - DOI - PMC - PubMed
    1. Avecilla S.T., Hattori K., Heissig B., Tejada R., Liao F., Shido K., Jin D.K., Dias S., Zhang F., Hartman T.E., et al. 2004. Chemokine-mediated interaction of hematopoietic progenitors with the bone marrow vascular niche is required for thrombopoiesis. Nat. Med. 10:64–71 10.1038/nm973 - DOI - PubMed
    1. Behnke O., Forer A. 1998. From megakaryocytes to platelets: platelet morphogenesis takes place in the bloodstream. Eur. J. Haematol. Suppl. 61:3–23 - PubMed

Publication types

MeSH terms