. 2013 Feb 15;591(4):859-74.
doi: 10.1113/jphysiol.2012.236869. Epub 2012 Nov 12.

Evolutionarily conserved differences in pallial and thalamic short-term synaptic plasticity in striatum

Affiliations

Evolutionarily conserved differences in pallial and thalamic short-term synaptic plasticity in striatum

Jesper Ericsson et al. J Physiol. .

Abstract

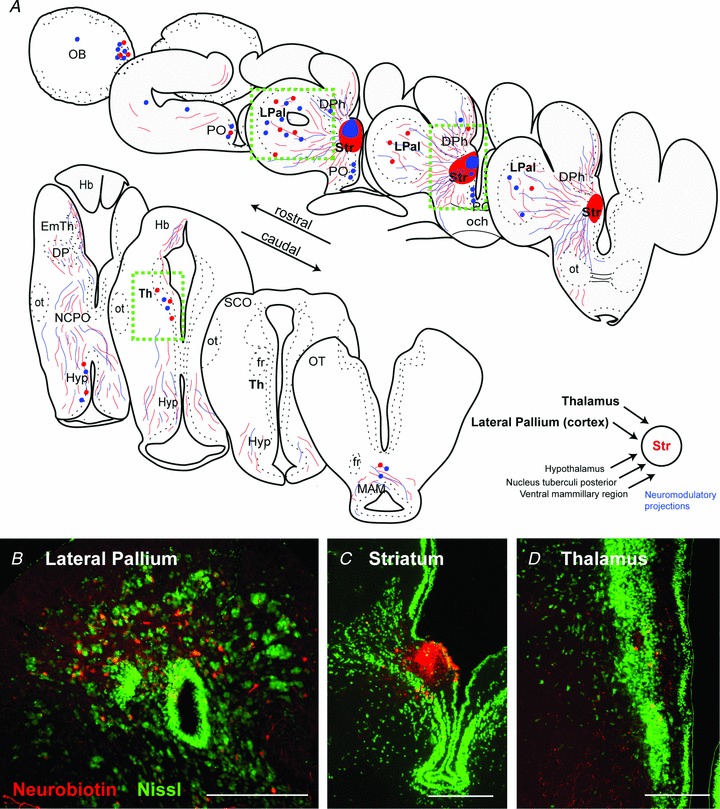
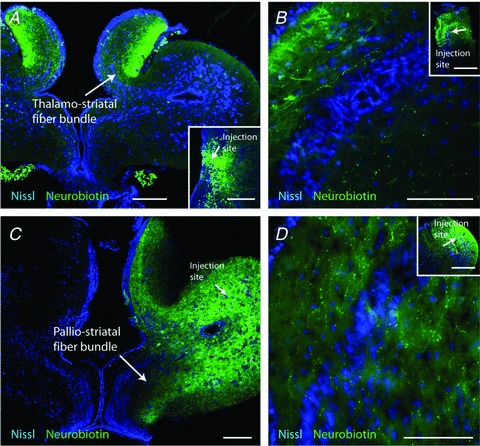
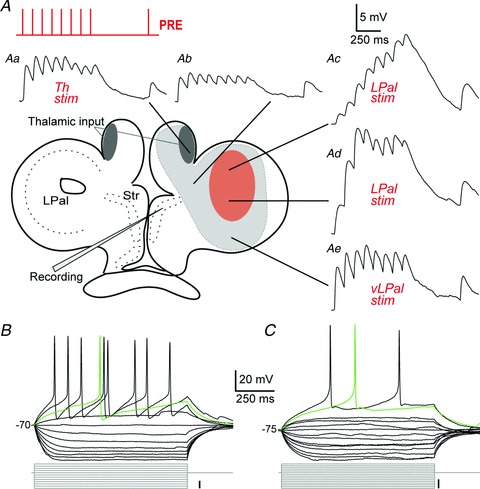
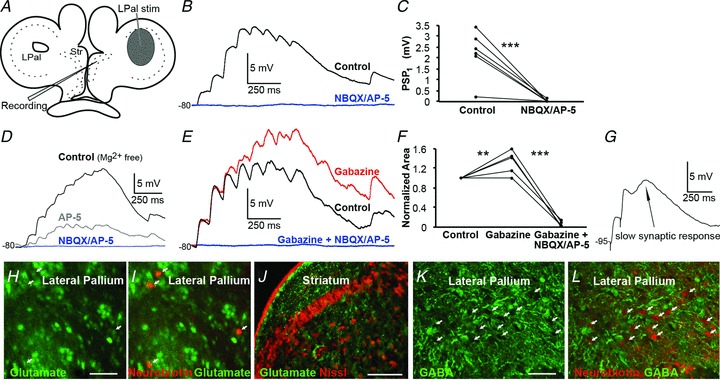
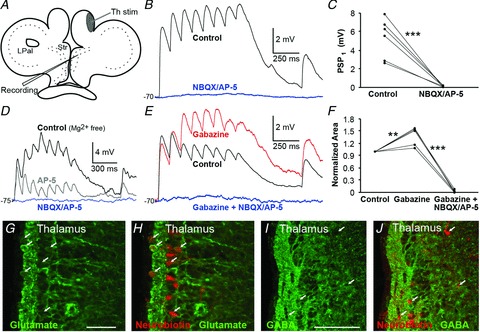
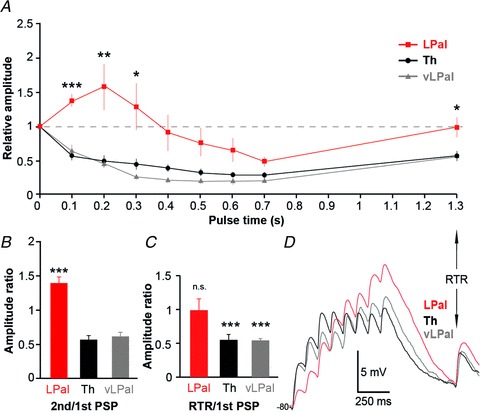
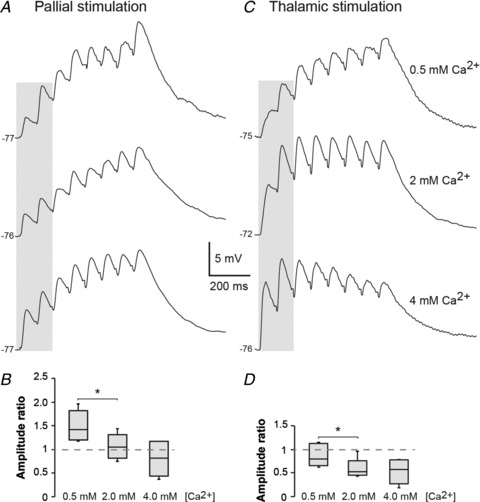
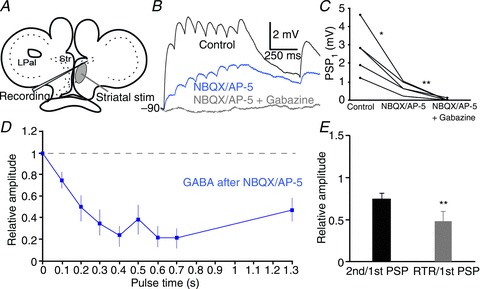
The striatum of the basal ganglia is conserved throughout the vertebrate phylum. Tracing studies in lamprey have shown that its afferent inputs are organized in a manner similar to that of mammals. The main inputs arise from the thalamus (Th) and lateral pallium (LPal; the homologue of cortex) that represents the two principal excitatory glutamatergic inputs in mammals. The aim here was to characterize the pharmacology and synaptic dynamics of afferent fibres from the LPal and Th onto identified striatal neurons to understand the processing taking place in the lamprey striatum. We used whole-cell current-clamp recordings in acute slices of striatum with preserved fibres from the Th and LPal, as well as tract tracing and immunohistochemistry. We show that the Th and LPal produce monosynaptic excitatory glutamatergic input through NMDA and AMPA receptors. The synaptic input from the LPal displayed short-term facilitation, unlike the Th input that instead displayed strong short-term synaptic depression. There was also an activity-dependent recruitment of intrastriatal oligosynaptic inhibition from both inputs. These results indicate that the two principal inputs undergo different activity-dependent short-term synaptic plasticity in the lamprey striatum. The difference observed between Th and LPal (cortical) input is also observed in mammals, suggesting a conserved trait throughout vertebrate evolution.


Figures

Figure 1
Figure 1. Mapping of striatal afferent input
A, schematic transverse sections through the lamprey brain showing the location of retrogradely labelled cells (red and blue dots) and anterogradely labelled fibres (red and blue lines) from two injection sites (neurobiotin) into the striatum. Injection site in the striatum (C) resulted in retrogradely labelled neurons throughout the LPal (B) and the Th (D). In addition, retrograde labelled neurons were observed in the olfactory bulbs, preoptic nucleus, medial pallium, hypothalamus, nucleus tuberculi posterior and mammillary area. Nissl stain in green in B–D. Scale bars, 200 μm in B–D. DPh, habenula projecting dorsal pallidum; EmTh, eminentia thalami; fr, fasciculus retroflexus; Hb, habenula; Hyp, hypothalamus; LPal, lateral pallium; MAM, mammillary area; NCPO, nucleus of the postoptic commissure; OB, olfactory bulb; och, optic chiasm; ot, optic tract; OT, optic tectum; PO, preoptic nucleus; SCO, subcommissural organ; Str, striatum; Th, thalamus.
Figure 2
Figure 2. Mapping of lateral palliostriatal and thalamostriatal fibres
A, anterograde labelling of thalamostriatal fibres after injection of neurobiotin in the Th, injection site inserted in the bottom-right part. The dense, anterogradely labelled thalamostriatal fibre tract was located in the most lateral neuropil of the medial pallium and limited to a well-defined narrow portion of the slice towards the striatum. B, anterogradely labelled thalamostriatal fibres in the striatum following an injection in the Th (inset). C, neurobiotin injections in the LPal anterogradely labelled fibres throughout the lateral and ventral striatal neuropil (arrows). Injection site indicated in the LPal. D, anterogradely labelled palliostriatal fibres in the striatum following an injection in the LPal (inset). Scale bars, 200 μm in A and C; 100 μm in B and D; and 500 μm in B and D inset.
Figure 3
Figure 3. Extracellular stimulation of striatal afferents
A, schematic overview of a transverse brain slice indicating the extracellular stimulation sites of striatal afferents. The light grey shading indicates areas from which striatal responses were readily evoked, including a red shading of the stimulation region in the LPal. The presynaptic stimulus train of 8 + 1 pulses at 10 Hz is indicated in the top left corner. Aa–e, voltage responses to stimulation (stimulation artefacts removed) of Th fibres (Aa, thalamostriatal fibres indicated by dark grey shading), the adjacent area dorsal to the striatum (Ab), the LPal (Ac and d) and the most ventral part of the LPal (Ae). Neurons were held just below −80 mV before stimulating presynaptic fibres. B, recorded neurons were a mix of inwardly rectifying neurons and non-rectifying neurons (C), shown by their voltage responses to hyperpolarizing and depolarizing current injections. The green traces represent the first, single action potentials evoked by the depolarizing steps. Scale bars for the current injections indicate 10 pA. LPal, lateral pallium; Str, striatum; Th, thalamus; vLPal, ventrolateral pallium.
Figure 4
Figure 4. Lateral palliostriatal stimulation evokes glutamatergic synaptic responses
A, schematic drawing indicating the stimulation area in lateral pallium (LPal). B, current-clamp recordings of striatal postsynaptic potentials (PSPs) in regular aCSF evoked by LPal stimulation (artefacts removed), before (black trace) and after application of NBQX (40 μm) and AP-5 (50 μm, blue trace). C, application of NBQX and AP-5 completely removed the postsynaptic response, quantified by comparing the first PSP response in the train before and after drug application. D, NMDA and AMPA receptors were investigated in Mg2+-free aCSF by current-clamp recordings of striatal PSPs evoked by LPal stimulation before (black trace) and after sequential application of AP-5 (grey trace), and both AP-5 and NBQX (blue trace) at about −80 mV. E, application of gabazine (20 μm, red trace) increased responses in recorded neurons (rest Vm−80 mV) indicative of oligosynaptic inhibition. Responses were completely removed by further application of NBQX and AP-5 (blue trace). F, quantification of the effect of drugs in (E) was performed by comparing the normalized area under the response curve before and after application. G, a slow synaptic response revealed by paired-pulse stimulation (artefacts from stimulation included for clarity). The neuron was held at a hyperpolarized potential (−95 mV) where GABA is depolarizing. H, immunostaining for glutamate (green) in LPal. I, retrogradely labelled neurons (red, indicated by arrows) in the LPal were immunostained for glutamate seen by co-staining. J, immunostaining showed glutamatergic fibres (green) surrounding the striatal cell band (red Nissl staining). K, immunostaining for GABA (green) in the LPal. L, retrogradely labelled neurons (red) were GABA-immunonegative as there was no co-staining with GABA. Scale bars, 50 μm in H and K; 200 μm in J. **P < 0.01, ***P < 0.001, two-tailed paired t tests. Str, striatum.
Figure 5
Figure 5. Thalamostriatal synaptic responses are glutamatergic
A, schematic drawing indicating stimulation area of Th fibres in the most lateral region of the medial pallium. B, striatal postsynaptic potentials (PSPs) in regular aCSF in response to stimulation of Th fibres (black trace) and application of NBQX (40 μm) and AP-5 (50 μm), that completely removed all responses (blue trace), quantified by comparing the amplitude of the first PSP before and after drug application (C). D, NMDA and AMPA receptors were investigated in Mg2+-free aCSF by current-clamp recordings of striatal PSPs in response to stimulation of Th fibres (black trace), and after sequential application of AP-5 (grey trace) and both AP-5 and NBQX (blue trace) at about −75 mV. E, application of gabazine (20 μm, red trace) increased responses in recorded neurons (rest Vm−70 mV), indicative of oligosynaptic inhibition. Responses were completely removed by further application of NBQX and AP-5 (blue trace). F, quantification of the effect of drugs in (E). G, glutamate immunostaining (green) of the Th showed that the cell layer is packed with glutamatergic neurons. H, retrogradely labelled neurons (red) from the striatum are glutamatergic as indicated by the arrows and the co-staining. I, immunostaining for GABA (green) in the Th. J, retrogradely labelled neurons (red) were GABA-immunonegative as there was no co-staining with GABA. Scale bars, 50 μm in G; 100 μm in I. **P < 0.01, ***P < 0.001, two-tailed paired t tests. LPal, lateral pallium; Str, striatum; Th, thalamus.
Figure 6
Figure 6. Lateral palliostriatal and thalamostriatal synapses have different dynamics
A, normalized postsynaptic responses to stimulations in lateral pallium (LPal; red squares), ventrolateral pallium (vLPal; grey triangles) and thalamus (Th; black circles) including the normalized recovery test response (RTR) 600 ms after the 8th pulse in the stimulus train. B, comparison of the paired-pulse ratio of the second postsynaptic potential (PSP) to the first PSP in response to stimulations of fibres from the Th, LPal and vLPal (Th PPD 0.56 ± 0.07; vLPal PPD 0.61 ± 0.12; P < 0.001 compared with LPal). C, comparisons of the RTR of LPal, vLPal and Th stimulation. D, postsynaptic response patterns in the same neuron to LPal (red), vLPal (grey) and Th (black) stimulations, baseline potential at −80 mV. *P < 0.05, **P < 0.01, ***P < 0.001, two-tailed paired t tests.
Figure 7
Figure 7. Altering extracellular calcium concentration changes striatal short-term synaptic plasticity from the LPal and Th
A, postsynaptic voltage responses to stimulation of the LPal in three different extracellular Ca2+ concentrations: 0.5 mm (top trace); 2 mm (middle trace); and 4 mm (bottom trace). B, box-plot of the paired-pulse ratio of the first two palliostriatal responses (grey shading in A) that was increased by lowering the Ca2+ concentration to 0.5 mm compared with the regular aCSF calcium concentration of 2 mm. C, voltage responses to stimulation of thalamostriatal fibres in the same conditions as in A. D, box-plot of the paired-pulse ratio of the first two thalamostriatal responses (shading in C) where the synaptic depression was decreased in 0.5 mm Ca2+ concentration. *P < 0.05.
Figure 8
Figure 8. Intrastriatal stimulation evokes glutamatergic and GABAergic responses
A, schematic drawing indicating stimulation area in the striatum (Str). B, striatal postsynaptic potentials (PSPs; black trace) in response to intrastriatal stimulation and application of NBQX (40 μm) and AP-5 (50 μm) significantly reduces postsynaptic responses (blue trace), but they were only completely removed after additional application of gabazine (20 μm, grey trace). Neurons were held at hyperpolarized potentials where GABA is depolarizing, here at −90 mV. C, quantification of the synaptic effects of drugs was performed by comparing the amplitude of the first PSP in the pulse train. D, normalized postsynaptic depressing intrastriatal GABAergic responses, isolated after application of NBQX and AP-5. E, the paired-pulse ratio (black) and the recovery test ratio (RTR; grey) of GABAergic responses that are both depressed. *P < 0.05, **P < 0.01, two-tailed paired t tests. LPal, lateral pallium.

Similar articles

Cited by

References

    1. Barral J, Galarraga E, Tapia D, Flores-Barrera E, Reyes A, Bargas J. Dopaminergic modulation of spiny neurons in the turtle striatum. Cell Mol Neurobiol. 2010;30:743–750. - PMC - PubMed
    1. Brodin L, Hokfelt T, Grillner S, Panula P. Distribution of histaminergic neurons in the brain of the lamprey Lampetra fluviatilis as revealed by histamine-immunohistochemistry. J Comp Neurol. 1990a;292:435–442. - PubMed
    1. Brodin L, Theordorsson E, Christenson J, Cullheim S, Hökfelt T, Brown J, Buchan A, Panula P, Verhofstad A, Goldstein M. Neurotensin-like peptides in the CNS of lampreys: chromatographic characterisation and immunohistochemical localisation with reference to aminergic markers. Eur J Neurosci. 1990b;2:1095–1109. - PubMed
    1. Buchwald NA, Price DD, Vernon L, Hull CD. Caudate intracellular response to thalamic and cortical inputs. Exp Neurol. 1973;38:311–323. - PubMed
    1. Calabresi P, Pisani A, Mercuri NB, Bernardi G. Long-term potentiation in the striatum is unmasked by removing the voltage-dependent magnesium block of NMDA receptor channels. Eur J Neurosci. 1992;4:929–935. - PubMed

Publication types

LinkOut - more resources