. 2013 Feb 15;591(4):1111-31.
doi: 10.1113/jphysiol.2012.242750. Epub 2012 Nov 12.

Failure of action potential propagation in sensory neurons: mechanisms and loss of afferent filtering in C-type units after painful nerve injury

Affiliations

Failure of action potential propagation in sensory neurons: mechanisms and loss of afferent filtering in C-type units after painful nerve injury

Geza Gemes et al. J Physiol. .

Abstract

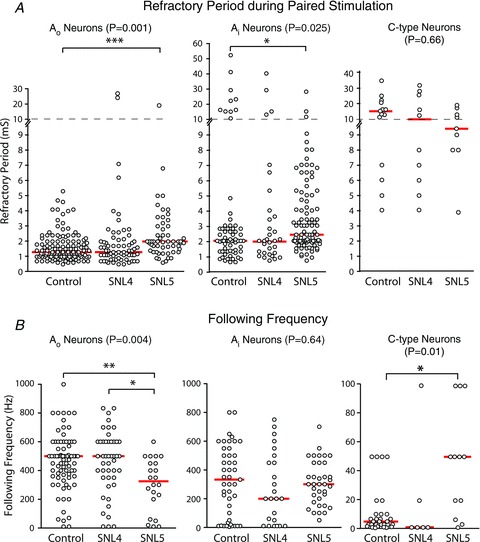
The T-junction of sensory neurons in the dorsal root ganglion (DRG) is a potential impediment to action potential (AP) propagation towards the CNS. Using intracellular recordings from rat DRG neuronal somata during stimulation of the dorsal root, we determined that the maximal rate at which all of 20 APs in a train could successfully transit the T-junction (following frequency) was lowest in C-type units, followed by A-type units with inflected descending limbs of the AP, and highest in A-type units without inflections. In C-type units, following frequency was slower than the rate at which AP trains could be produced in either dorsal root axonal segments or in the soma alone, indicating that the T-junction is a site that acts as a low-pass filter for AP propagation. Following frequency was slower for a train of 20 APs than for two, indicating that a cumulative process leads to propagation failure. Propagation failure was accompanied by diminished somatic membrane input resistance, and was enhanced when Ca(2+)-sensitive K(+) currents were augmented or when Ca(2+)-sensitive Cl(-) currents were blocked. After peripheral nerve injury, following frequencies were increased in axotomized C-type neurons and decreased in axotomized non-inflected A-type neurons. These findings reveal that the T-junction in sensory neurons is a regulator of afferent impulse traffic. Diminished filtering of AP trains at the T-junction of C-type neurons with axotomized peripheral processes could enhance the transmission of activity that is ectopically triggered in a neuroma or the neuronal soma, possibly contributing to pain generation.


Figures

Figure 1
Figure 1. Depiction of the preparation and description of measured parameters
A, the preparation, showing recording via an intracellular electrode (which in some experiments was also used for stimulation), axonal stimulation and the peripheral axonal injury at the level of the spinal nerve. Components are not to scale. B, measurements determined from action potential (AP) trace. AHP80%, duration of afterhyperpolarization until 80% recovery to baseline; AHPamp, amplitude of afterhyperpolarization; AHParea, area of the afterhyperpolarization; AHPd, afterhyperpolarization duration; APamp, amplitude of AP; APd, duration of the AP at 95% repolarization; RMP, resting membrane potential. C, AP trace (above) and differentiated wave (below) from an Ao-type neuron that lacks an inflection on the descending limb of the AP. D, AP trace (above) and differentiated wave (below) from an Ai-type neuron, showing an inflection on the descending limb of the AP, as confirmed in the differentiated trace with an interval of decreased negative slope (arrows). Note C and D have different V s−1 and time scales. E and F, somatic voltage traces during paired axonal stimulation in two different neurons. Recordings of successively shorter interstimulus intervals are superimposed. Stimuli are evident as downward deflections in the voltage traces. The neuron in E shows failure of conduction into the soma at a RP of 1.3 ms, at which interval there is a complete absence of a somatic voltage response. The neuron in F shows failure of full somatic invasion at a RP of 1.4 ms, at which interval there is a decreased somatic depolarization (single arrow), representing a passive electrotonic potential. The final complete failure of propagation of the second AP (double arrow) occurs at a shorter interstimulus interval. The electrotonic potentials (single arrow) represent AP failure in the stem axon, while complete absence of an impulse (double arrow) represents failure at the T-junction.
Figure 2
Figure 2. Sample voltage traces from four different neurons showing the somatic response to axonal stimulation at the following frequency and at a higher frequency at which conduction fails (*), both at the same time and voltage scales
The aRMP at the initiation of the 2nd and last action potentials (APs) are marked with an arrowhead. Separately, the last AP of the train is aligned with the trace of a single AP from the same cell, shown at a compressed time scale and with APs that are truncated (indicated by a double slash). Stimulus artefacts are truncated. A, a C-type neuron from the L4 DRG after SNL demonstrates a depolarizing shift in the aRMP at following frequency. B, a Control Ai neuron shows depolarization of the aRMP during the train and progressive replacement of APs by incomplete depolarizations (electrotonic potentials), indicative of conduction failure in the stem axon. At a higher frequency, complete absence of somatic depolarization is evident as well (*), indicative of propagation failure at the T-branch. C, a Control Ao neuron in which the aRMP depolarizes during the train to a potential that is depolarized relative to the original RMP, and reveals an ADP following the last AP. D, an Ao neuron from L5 after SNL develops hyperpolarization during the train.
Figure 3
Figure 3. Confirmation by collision experiments that somatic potential recordings indicate T-junction events
L5 DRGs were removed with the sciatic nerve attached, which was used for peripheral process stimuli (P1 and P2), while central process stimulation (C) was performed at the dorsal root (A). The interval between P2 and C stimuli was held constant, while the timing of the preceding peripheral pulse (P1) was variable. Somatic events resulting from these stimuli are labelled beneath the depolarization. In this recording of an Ao neuron (central CV = 12 m s−1, peripheral CV = 14 m s−1), stimulus artefacts are shown in B and C, but were subtracted in other panels. B, both P1 and P2 stimuli (arrows) result in full somatic APs. (No C stimulus was provided.) C. a shorter P1–P2 interstimulus interval (isi) results in a reduced P2 depolarization, representing the electrotonic potential from an AP that failed in the stem axon before invading the soma. (Again, no C stimulus was provided.) D. a single central stimulus produces a somatic AP. (No P stimuli were provided.) E. the C depolarization is absent due to collision of the C AP in the central process with the P2 AP, which has successfully transited the T-junction. F, a shorter P1–P2 interval produces only an electrotonic P2 potential in the soma, but the C depolarization is still absent, indicating passage of the P2 AP into the central process. G, a still shorter P1–P2 interval results in complete failure of P2 somatic depolarization, accompanied by the arrival of an unblocked C AP in the soma. This demonstrates that a somatic electrotonic potential represents an AP transiting the T-junction, while complete failure of somatic depolarization represents AP propagation failure at the T-branch. Findings in three other neurons were the same, including one in which polarities were reversed (paired central stimuli colliding with a late peripheral stimulus).
Figure 4
Figure 4. Influence of neuronal type and injury on impulse propagation
A, RP of sensory neurons during paired stimulation. Panels show data according to neuron type and the injury group. Spinal nerve ligation (SNL)4 and SNL5 are neurons from the L4 and L5 ganglions from animals after SNL surgery. The central indicator bars represent the median value. The P-value indicates the probability of a main effect for injury, and significant post hoc comparisons are shown by connecting brackets. *P < 0.05, ***P < 0.001. Note the broken y-axis with two different scales. B, the maximal stimulation rate (the following frequency) that leads to conduction into the stem axon of all APs in a train of 20 APs. **P < 0.01.
Figure 5
Figure 5. Site and mechanism of impulse propagation failure
A, testing maximum axonal firing rate in C-type units in excised dorsal roots. A sample trace (CV = 1.03 m s−1) during stimulation (90 Hz) of the dorsal root segment at the end transected from the spinal cord and recorded from fibres teased from the end transected from the DRG. The first 3 and last 7 APs (arrows) of the train are shown. Stimulation rate is 90 Hz, and the conduction latency is 27.1 ms for the first AP and 29.7 ms for the 20th AP. Summary data from this and other C-type units (n = 18) are shown in the right panel, in which open circles represent recordings in which the rate is assigned as the highest observed following frequency prior to the AP being occluded by the stimulus artefact at higher frequencies, thus making these data possible underestimates. Filled circles represent data for which failure was directly observed at the next higher frequency. The central indicator bars represent the median value for the entire group. B, comparison of the maximum rate at which APs in C-type neurons can propagate through the axonal T-junction (‘Axon’), versus the maximum rate at which the same neuron's soma can fire all of a train of 20 APs during direct somatic current injection (‘Soma’). Conduction through the T-junction was confirmed by the generation of a depolarization, including either an AP or an incomplete electrotonic depolarization, during axonal stimulation. The central indicator bars represent the median value. Main effect of Injury Group P < 0.01; main effect of Stimulation Site P < 0.001; significant post hoc comparisons are shown by connecting brackets, *P < 0.05. C, sensitivity of following frequency to modulation of various Ca2+-sensitive channels. Repeat determinations show stable responses in time controls. Increasing Ca2+ influx during neuronal activation by elevating bath Ca2+ concentration from baseline (2 mm) to 8.0 mm decreased maximal following frequency. Activation of SK and IK subtypes of Ca2+-activated K+ channels with NS309 (5 μm) also decreased following frequency. Activation of the BK subtype of Ca2+-activated K+ channels with NS1619 (10 μm) had no effect on following frequency. Blockade of Ca2+-activated Cl channels with niflumic acid (Nif A; 100 μm) decreased following frequency. Blockade of the HCN channels with ZD7288 (10 μm) had no effect. Bars show mean ± SEM. Significance testing was done by Student's t test before converting to percentage change, *P < 0.05, **P < 0.01; numbers in the bar are n.
Figure 6
Figure 6. Superimposed AHPs following trains composed of from 1 to 20 action potentials (APs) in two different neurons
In one (A), the amplitude of the fast AHP shows progressive decrement, concurrent with the development of a slower AHP component with greater number of preceding APs. Other neurons, such as that shown in B, show a progressive decrease of the fast component amplitude and its eventual disappearance, along with the development of a slower component. The AHP will influence the membrane voltage at which the next AP in a train is initiated (aRMP) according to the interstimulus interval. Rates that place the following APs initiation to the left of the dotted arrows will result in progressive depolarization of the aRMP as the fast AHP diminishes. Slow rates will have AP initiations to the right of the dotted arrow, and result in progressive hyperpolarization of the aRMP. The scale bars apply to both neurons.
Figure 7
Figure 7. Shift of the apparent resting membrane potential (aRMP) during a stimulus train at each neuron's following frequency
The ordinate indicates the aRMP of the 20th AP minus the aRMP of the 2nd AP in a train of 20 APs. The P-value indicates the probability of a main effect for injury. Ai neurons in the Control group and neurons from the L5 ganglion after spinal nerve ligation (SNL5 group) show a depolarizing shift of the aRMP during repetitive firing that is significantly greater than zero (one-sample Student's t test P < 0.01), as do Ao neurons in the Control and SNL4 group. The central indicator bars represent the median value.
Figure 8
Figure 8. The effect of firing rate on membrane voltage (Vm) during a train of APs
A, recording of somatic Vm during axonal stimulation. Conducted APs are initiated at a Vm that is influenced by the firing rate. Traces are shown at the same vertical scale, and APs are truncated except for traces at 10 Hz, 450 Hz and 500 Hz. The thin horizontal line indicates the Vm at the initiation of the second AP, thereby providing a reference to identify progressive hyper- or depolarization during the train. Original RMP is evident by a short segment at the beginning of each trace. In this Control Ao neuron, hyperpolarization is apparent up to a rate of 100 Hz, while depolarization develops thereafter. At 450 Hz and 500 Hz, some stimuli are followed by complete failure of conduction through the T-junction (marked by *). Other APs invade the stem axon, but either fail to generate an AP in the soma (producing only an electrotonic potential, ‘e’) or initiate an incomplete somatic component (‘i’). AP failure and electrotonic potentials lack a full AHP, which therefore interrupts the pattern of depolarization. Dotted straight-line segments fill gaps in the traces where stimulus artefacts were removed for clarity. B, summary data for a sample of 9 neurons (7 Ao, 2 Ai), showing a dependence of direction of shift of the apparent resting membrane potential (aRMP) upon firing rate. Data are mean ± SEM. C, in another neuron (Ao), periods of failed conduction (marked by *) interrupt hyperpolarization (at 50 Hz) and depolarization (150 Hz and 200 Hz), during which Vm recovers towards resting Vm along the trajectory of the previous AHP. This indicates that shifts in aRMP require membrane activation and are not the result of ongoing stimulation of adjacent neurons. Note also the recovery of the fast AHP (dotted arrow) after a brief period of membrane quiescence. Downward lines are stimulation artefacts.
Figure 9
Figure 9. The effect of an action potential (AP) train on subsequent input resistance in an uninjured Ao neuron
Input resistance, determined as the voltage change divided by current injected during a brief hyperpolarizing current injection, is depressed after a single AP (A), but recovers promptly to baseline. Following a train of 20 APs at 200 Hz (B), the same neuron shows a prolonged recovery of input resistance. The scale bars apply to both A and B. The current protocol for determining input resistance (C) consists of 0.5 nA hyperpolarizing current pulses lasting 7 ms, every 50 ms, starting 10 ms after the last AP. Summary data (mean ± SEM) of 15 A-type neurons (D) show a significantly longer recovery after a 20 pulse train than a single AP with significant differences (P < 0.05) up to 360 ms after the initiation of the AHP. Recovery from a train fits a biexponential with time constants 46 ms and 1578 ms. The time scale in D applies also to the other panels.

Similar articles

Cited by

References

    1. Abdulla FA, Smith PA. Axotomy- and autotomy-induced changes in Ca2+ and K+ channel currents of rat dorsal root ganglion neurons. J Neurophysiol. 2001;85:644–658. - PubMed
    1. Amir R, Devor M. Spike-evoked suppression and burst patterning in dorsal root ganglion neurons of the rat. J Physiol. 1997;501:183–196. - PMC - PubMed
    1. Amir R, Michaelis M, Devor M. Membrane potential oscillations in dorsal root ganglion neurons: role in normal electrogenesis and neuropathic pain. J Neurosci. 1999;19:8589–8596. - PMC - PubMed
    1. Bender KJ, Trussell LO. Axon initial segment Ca2+ channels influence action potential generation and timing. Neuron. 2009;61:259–271. - PMC - PubMed
    1. Bessou P, Burgess PR, Perl ER, Taylor CB. Dynamic properties of mechanoreceptors with unmyelinated (C) fibers. J Neurophysiol. 1971;34:116–131. - PubMed

Publication types