

White matter microstructural alterations in children with prenatal methamphetamine/polydrug exposure
- PMID: 23149028
- PMCID: PMC3634917
- DOI: 10.1016/j.pscychresns.2012.04.017
White matter microstructural alterations in children with prenatal methamphetamine/polydrug exposure
Abstract
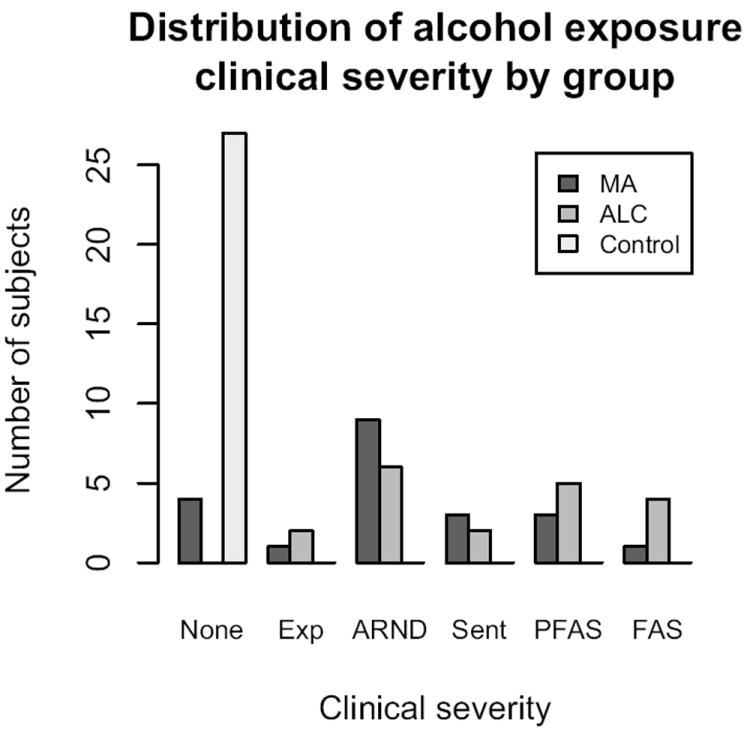
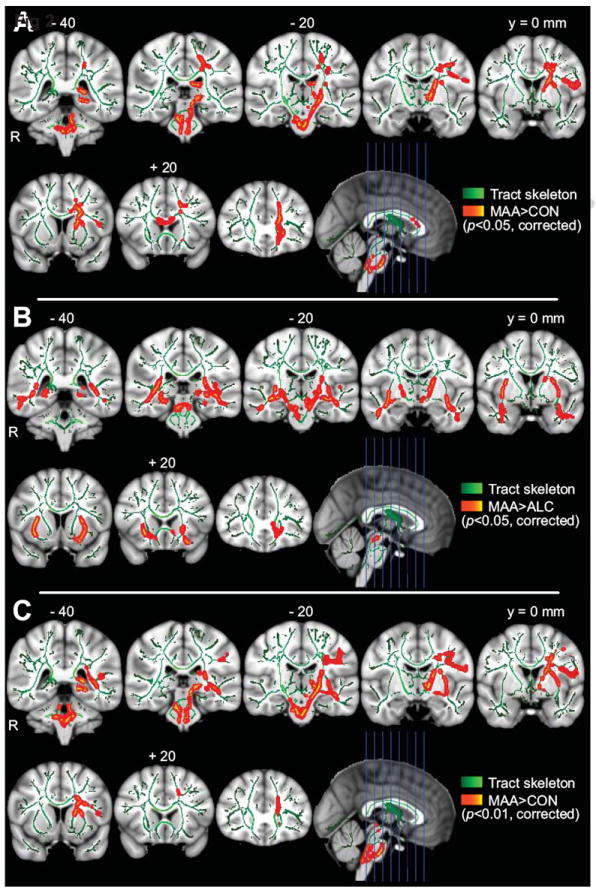
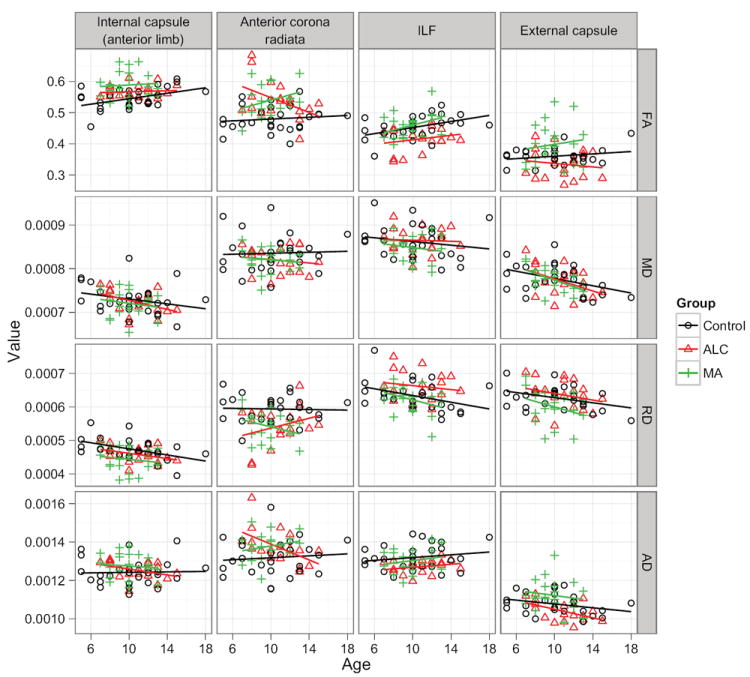
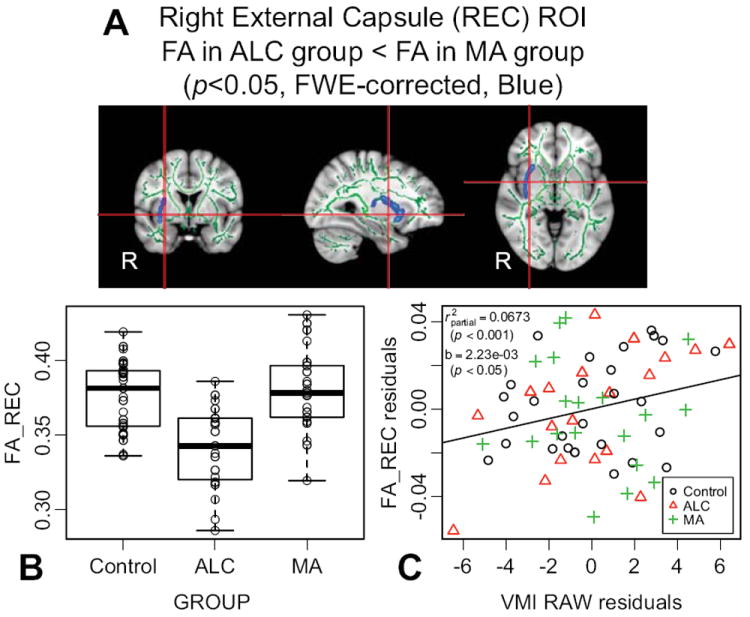
Little is known about the effects of prenatal methamphetamine exposure on white matter microstructure, and the impact of concomitant alcohol exposure. Diffusion tensor imaging and neurocognitive testing were performed on 21 children with prenatal methamphetamine exposure (age 9.8±1.8 years; 17 also exposed to alcohol), 19 children with prenatal alcohol but not methamphetamine exposure (age 10.8±2.3 years) and 27 typically developing children (age 10.3±3.3 years). Whole-brain maps of fractional anisotropy (FA) were evaluated using tract-based spatial statistics. Relative to unexposed controls, children with prenatal methamphetamine exposure demonstrated higher FA mainly in left-sided regions, including the left anterior corona radiata (LCR) and corticospinal tract Post-hoc analyses of these FA differences showed they likely result more from lower radial diffusivity (RD) than higher axial diffusivity (AD). Relative to the methamphetamine-exposed group, children with prenatal alcohol exposure showed lower FA in frontotemporal regions-particularly, the right external capsule. We failed to find any group-performance interaction (on tests of executive functioning and visuomotor integration) in predicting FA; however, FA in the right external capsule was significantly associated with performance on a test of visuomotor integration across groups. This report demonstrates unique diffusion abnormalities in children with prenatal methamphetamine/polydrug exposure that are distinct from those associated with alcohol exposure alone, and illustrates that these abnormalities in brain microstructure are persistent into childhood and adolescence--long after the polydrug exposure in utero.
Copyright © 2012 Elsevier Ireland Ltd. All rights reserved.
Figures
References
-
- Anon . Results from the 2007 NSDUH: National Findings, Substance Abuse and Mental Health Services Administration. Rockville, MD: 2008.
-
- Astley SJ. Diagnostic guide for fetal alcohol spectrum disorders: the 4-digit diagnostic code. University of Washington; Seattle, WA: 2004.
-
- Bashat DB, Kronfeld-Duenias V, Zachor DA, Ekstein PM, Hendler T, Tarrasch R, Even A, Levy Y, Sira LB. Accelerated maturation of white matter in young children with autism: a high b value DWI study. Neuroimage. 2007;37:40–7. - PubMed
-
- Beaulieu C. The basis of anisotropic water diffusion in the nervous system - a technical review. NMR in Biomedicine. 2002;15:435–55. - PubMed
-
- Beery K. The Beery-Buktenica Developmental Test of Visual-Motor Integration: Administration, Scoring, and Teaching Manual. 4. Modern Curriculum Press; Parsippany, NJ: 1997.
Publication types
MeSH terms
Substances
Grants and funding
LinkOut - more resources
Full Text Sources
Medical
Miscellaneous
