

Improved corpus callosum area measurements by analysis of adjoining parasagittal slices
- PMID: 23149042
- PMCID: PMC4043221
- DOI: 10.1016/j.pscychresns.2012.05.004
Improved corpus callosum area measurements by analysis of adjoining parasagittal slices
Abstract
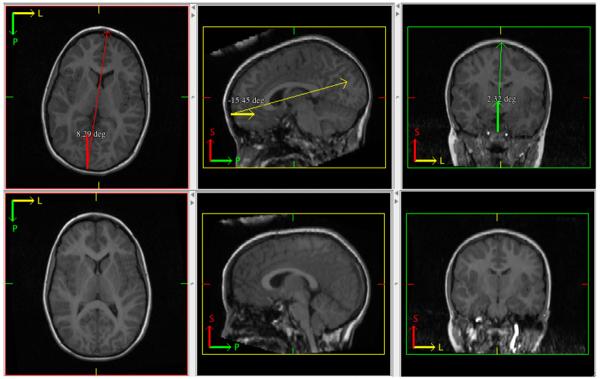
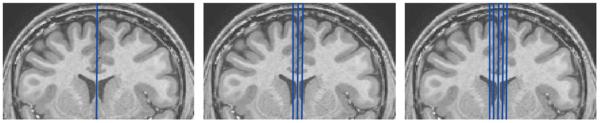
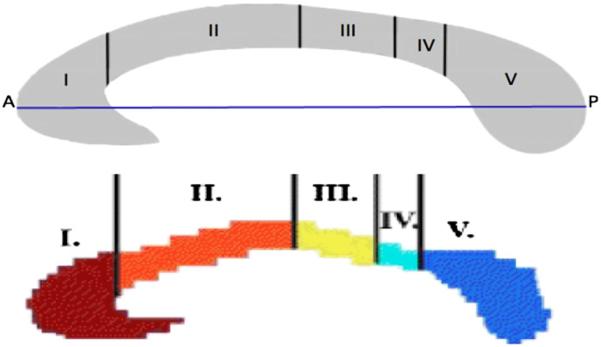
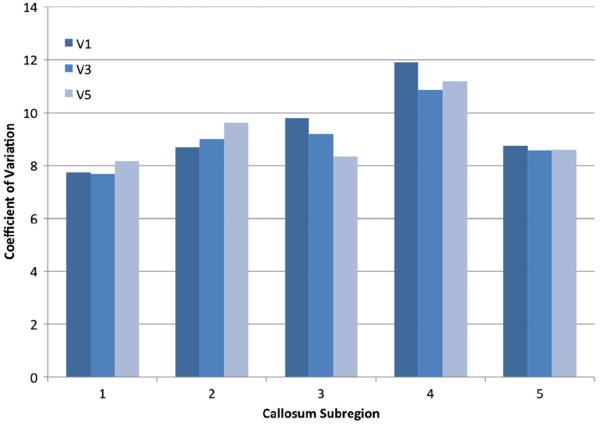
The corpus callosum (CC) is a bundle of approximately 180 million axons connecting homologous areas of the left and right cerebral cortex. Because CC projections are topographically organized, regional CC morphological abnormalities may reflect regional cortical developmental abnormalities. We assess the variance characteristics of three CC area measurement techniques by comparing a single midsagittal slice versus three slices (midsagittal plus one parasagittal on each side) and five slices (midsagittal plus two parasagittal on each side). CC images were partitioned into five subregions using the Hofer-Frahm scheme under the three methods and variance was examined via two complementary data sets. In the first, to control for intersubject variability, 12 scans were acquired from a single subject over the course of 3 h. In the second, we used scans from 56 healthy male volunteers between the ages of 10 and 27 years (mean=17.47, S.D.=3.42). Increasing the number of slices from one to three to five diminished the coefficient of variation (CV) within subregions and increased the power to detect differences between groups. A power analysis was conducted for the sample under each method to determine the sample size necessary to discern a given percent change (delta) ranging from 1 to 20% iteratively.
Published by Elsevier Ireland Ltd.
Figures
References
-
- Cohen J. Statistical Power Analysis for the Behavioral Sciences. 2nd ed. Erlbaum Associates; Hillsdale, N.J., Hove: 1988.
-
- Giedd JN, Shaw P, Wallace G, Gogtay N, Lenroot RK. Anatomic brain imaging studies of normal and abnormal brain development in children and adolescents. In: Cicchetti D, Cohen DJ, editors. Developmental Psychopathology. John Wiley & Sons; Hoboken, N.J.: 2006. pp. 127–194.
-
- Hofer S, Frahm J. Topography of the human corpus callosum revisited—comprehensive fiber tractography using diffusion tensor magnetic resonance imaging. Neuroimage. 2006;32:989–994. - PubMed
-
- Takao H, Hayashi N, Ohtomo K. Effect of scanner in longitudinal studies of brain volume changes. Journal of Magnetic Resonance Imaging. 2011;34:438–444. - PubMed
Publication types
MeSH terms
Grants and funding
LinkOut - more resources
Full Text Sources
Other Literature Sources
