

Critical closing pressure determined with a model of cerebrovascular impedance
- PMID: 23149558
- PMCID: PMC3564193
- DOI: 10.1038/jcbfm.2012.161
Critical closing pressure determined with a model of cerebrovascular impedance
Abstract
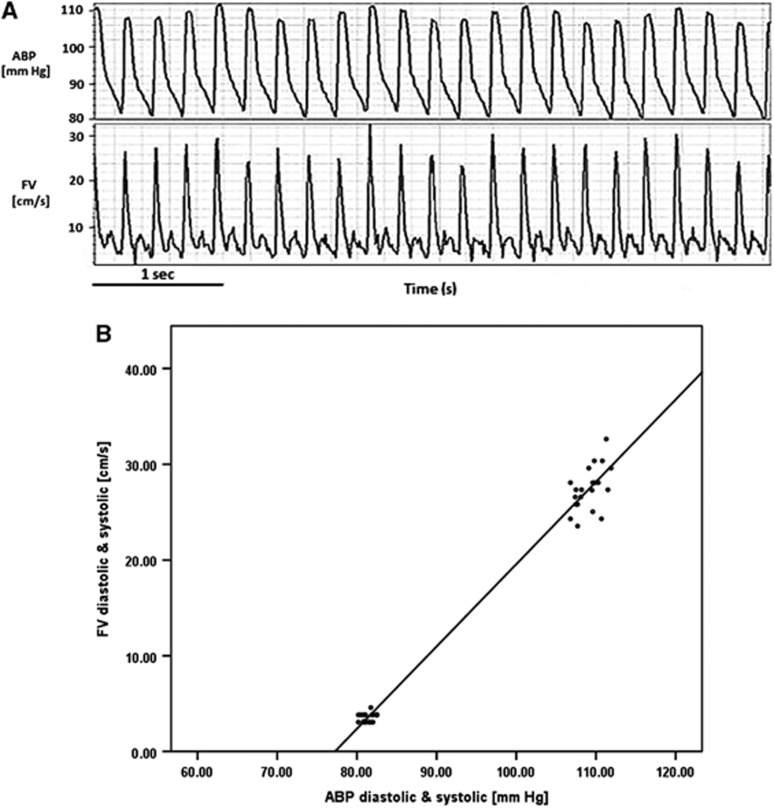
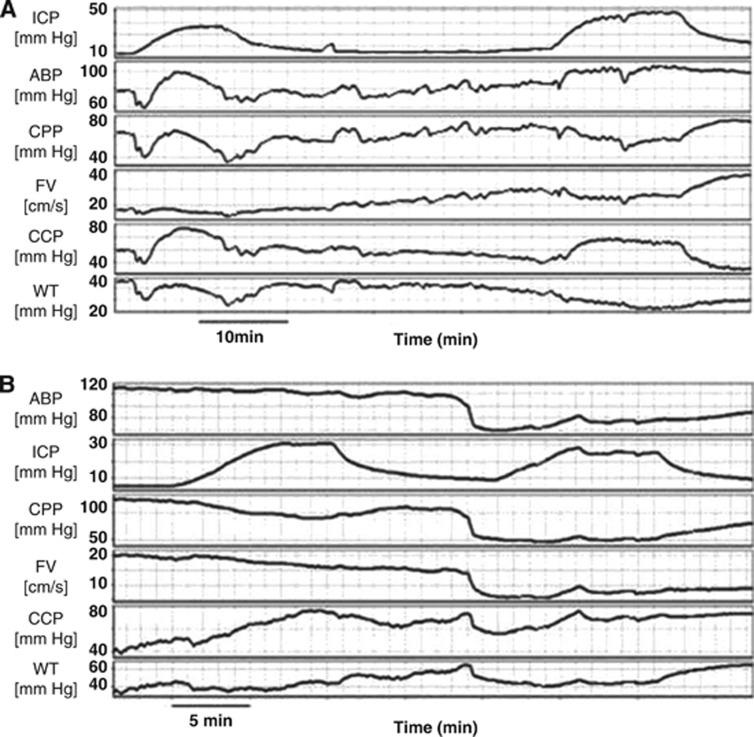
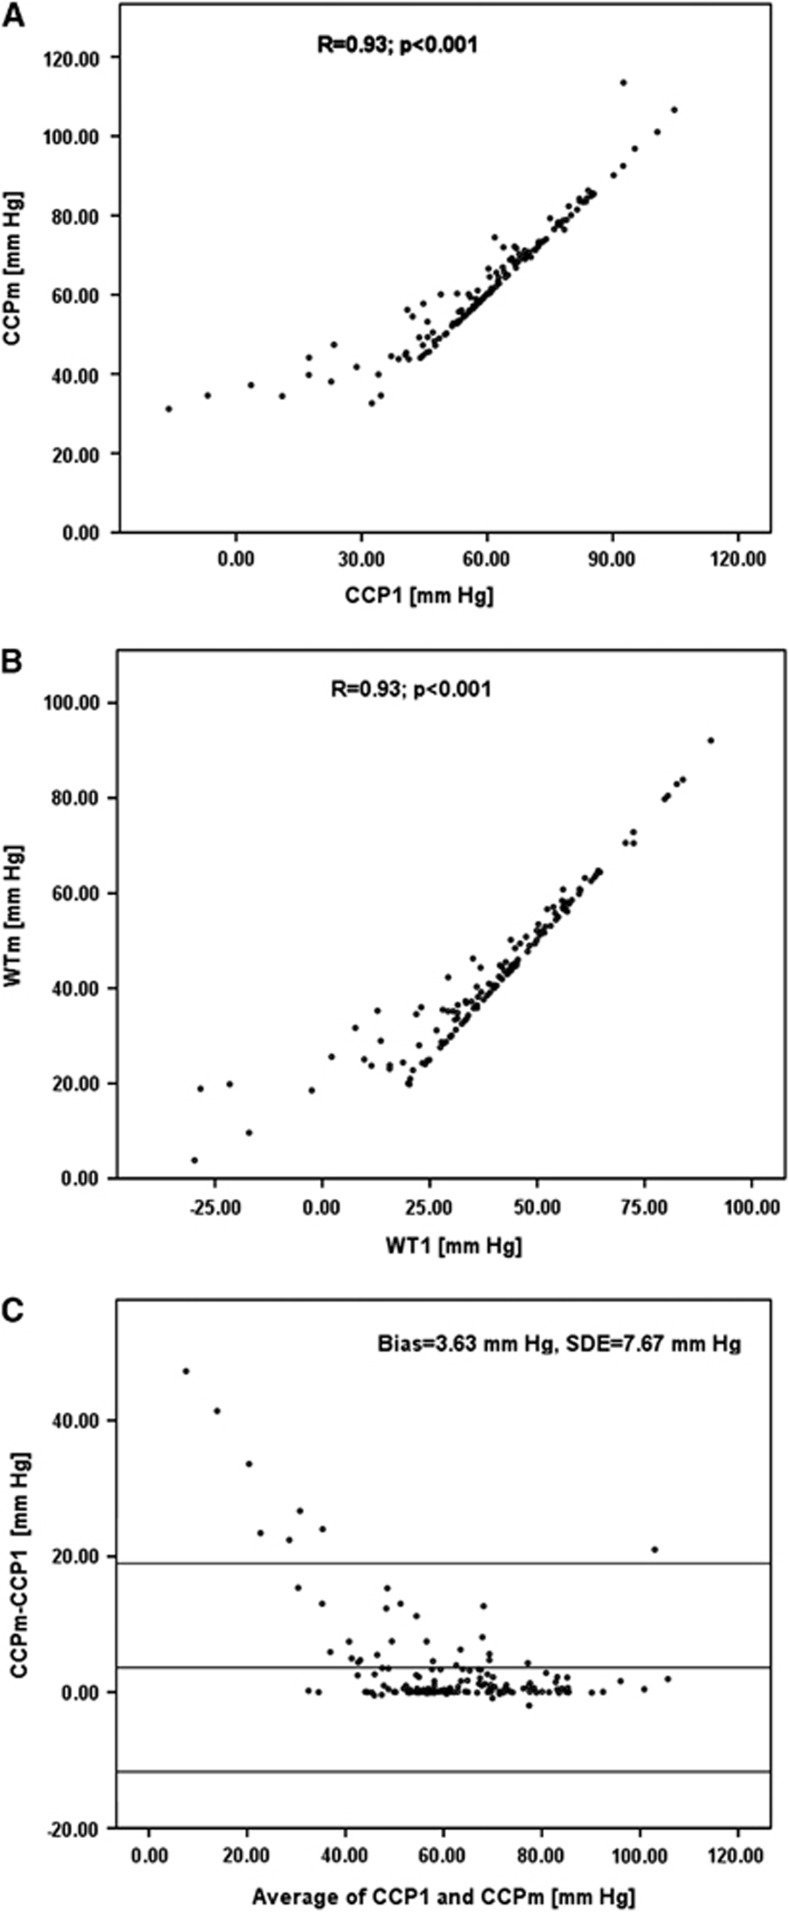
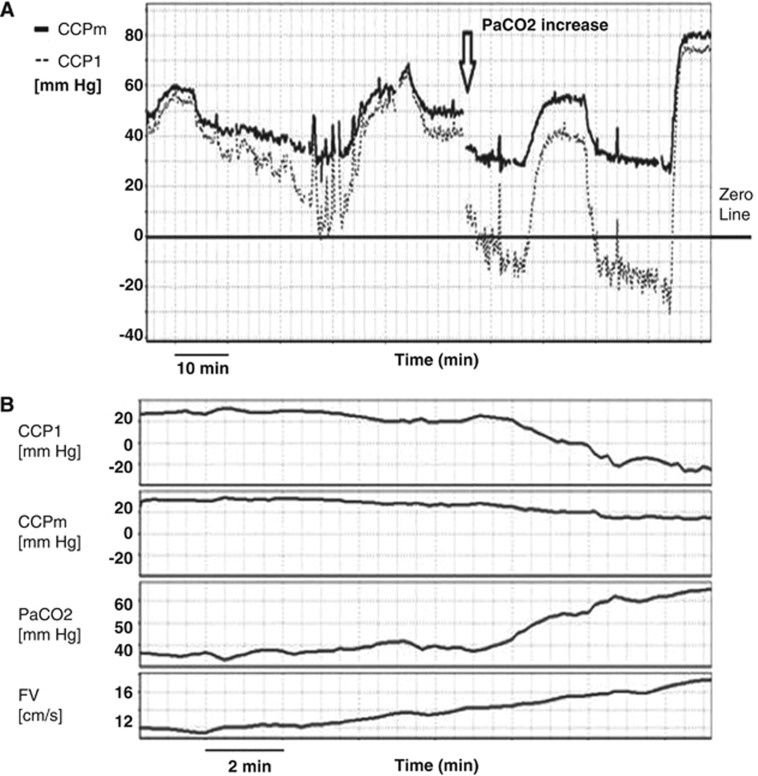
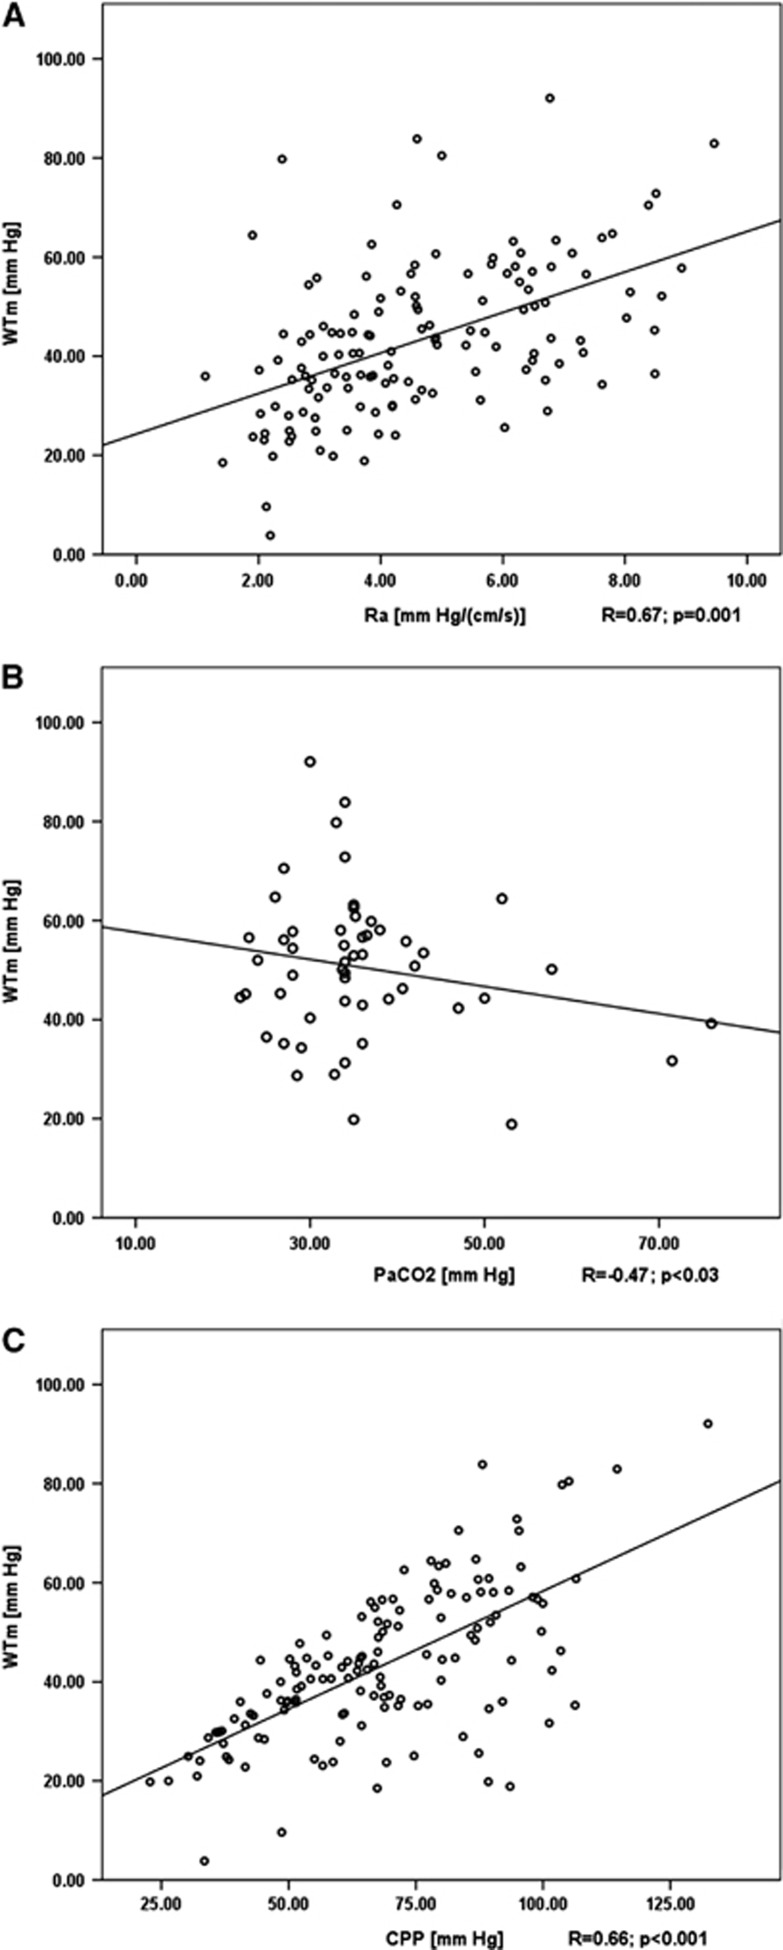
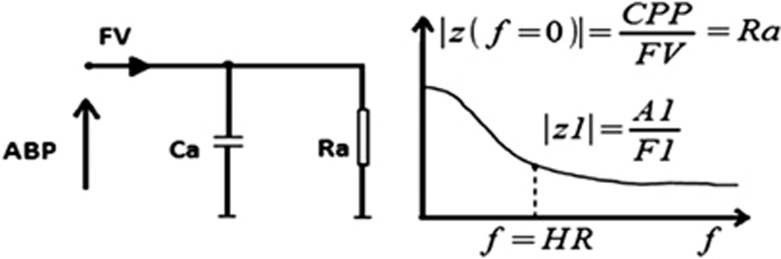
Critical closing pressure (CCP) is the arterial blood pressure (ABP) at which brain vessels collapse and cerebral blood flow (CBF) ceases. Using the concept of impedance to CBF, CCP can be expressed with brain-monitoring parameters: cerebral perfusion pressure (CPP), ABP, blood flow velocity (FV), and heart rate. The novel multiparameter method (CCPm) was compared with traditional transcranial Doppler (TCD) calculations of CCP (CCP1). Digital recordings of ABP, intracranial pressure (ICP), and TCD-based FV from previously published studies of 29 New Zealand White rabbits were reanalyzed. Overall, CCP1 and CCPm showed correlation across wide ranges of ABP, ICP, and PaCO2 (R=0.93, P<0.001). Three physiological perturbations were studied: increase in ICP (n=29) causing both CCP1 and CCPm to increase (P<0.001 for both); reduction of ABP (n=10) resulting in decrease of CCP1 (P=0.006) and CCPm (P=0.002); and controlled increase of PaCO2 (n=8) to hypercapnic levels, which decreased CCP1 and CCPm, albeit insignificantly (P=0.123 and P=0.306 respectively), caused by a spontaneous significant increase in ABP (P=0.025). Multiparameter mathematical model of critical closing pressure explains the relationship of CCP on brain-monitoring variables, allowing the estimation of CCP during cases such as hypercapnia-induced hyperemia, where traditional calculations, like CCP1, often reach negative non-physiological values.
Figures
Similar articles
-
Critical closing pressure during intracranial pressure plateau waves.Neurocrit Care. 2013 Jun;18(3):341-8. doi: 10.1007/s12028-013-9830-5. Neurocrit Care. 2013. PMID: 23512327
-
Assessment of critical closing pressure in the cerebral circulation as a measure of cerebrovascular tone.Acta Neurochir (Wien). 1999;141(11):1221-7 discussion 1226-7. doi: 10.1007/s007010050422. Acta Neurochir (Wien). 1999. PMID: 10592124
-
Cerebrovascular time constant: dependence on cerebral perfusion pressure and end-tidal carbon dioxide concentration.Neurol Res. 2012 Jan;34(1):17-24. doi: 10.1179/1743132811Y.0000000040. Neurol Res. 2012. PMID: 22196857
-
Clinical applications of a non-invasive ICP monitoring method.Eur J Ultrasound. 2002 Nov;16(1-2):37-45. doi: 10.1016/s0929-8266(02)00044-7. Eur J Ultrasound. 2002. PMID: 12470849 Review.
-
Monitoring of cerebrovascular autoregulation: facts, myths, and missing links.Neurocrit Care. 2009;10(3):373-86. doi: 10.1007/s12028-008-9175-7. Epub 2009 Jan 6. Neurocrit Care. 2009. PMID: 19127448 Review.
Cited by
-
Advancing Understanding of Cerebrovascular Hemodynamic Perturbations in Pediatric Cerebral Malaria Using a Modified Critical Closing Pressure Evaluation- A Prospective, Observational Study.Neurocrit Care. 2025 Apr 21. doi: 10.1007/s12028-025-02245-w. Online ahead of print. Neurocrit Care. 2025. PMID: 40257726
-
Cerebrovascular dynamics after pediatric traumatic brain injury.Front Physiol. 2023 Feb 17;14:1093330. doi: 10.3389/fphys.2023.1093330. eCollection 2023. Front Physiol. 2023. PMID: 36875032 Free PMC article.
-
Ontogeny of cerebrovascular critical closing pressure.Pediatr Res. 2015 Jul;78(1):71-5. doi: 10.1038/pr.2015.67. Epub 2015 Mar 31. Pediatr Res. 2015. PMID: 25826118
-
Cerebral haemodynamics during experimental intracranial hypertension.J Cereb Blood Flow Metab. 2017 Feb;37(2):694-705. doi: 10.1177/0271678X16639060. Epub 2016 Jul 21. J Cereb Blood Flow Metab. 2017. PMID: 26994043 Free PMC article.
-
Non-invasive Monitoring of Intracranial Pressure Using Transcranial Doppler Ultrasonography: Is It Possible?Neurocrit Care. 2016 Dec;25(3):473-491. doi: 10.1007/s12028-016-0258-6. Neurocrit Care. 2016. PMID: 26940914 Free PMC article. Review.
References
-
- Burton AC. Fundamental instability of the small blood vessels and critical closing pressure in vascular beds. Am J Physiol. 1951;164:330–331. - PubMed
-
- Brunner MJ, Greene AS, Sagawa K, Shoukas AA. Determinants of systemic zero-flow arterial pressure. Am J Physiol. 1983. pp. H453–H459. - PubMed
-
- Panerai RB. The critical closing pressure of the cerebral circulation. Med Eng Phys. 2003;25:621–632. - PubMed
-
- Dewey RC, Pierer HP, Hunt WE. Experimental cerebral hemodynamics-vasomotor tone, critical closing pressure, and vascular bed resistance. J Neurosurg. 1974. p. 41. - PubMed
Publication types
MeSH terms
Grants and funding
LinkOut - more resources
Full Text Sources
Other Literature Sources
