

Regulation of yeast central metabolism by enzyme phosphorylation
- PMID: 23149688
- PMCID: PMC3531909
- DOI: 10.1038/msb.2012.55
Regulation of yeast central metabolism by enzyme phosphorylation
Abstract
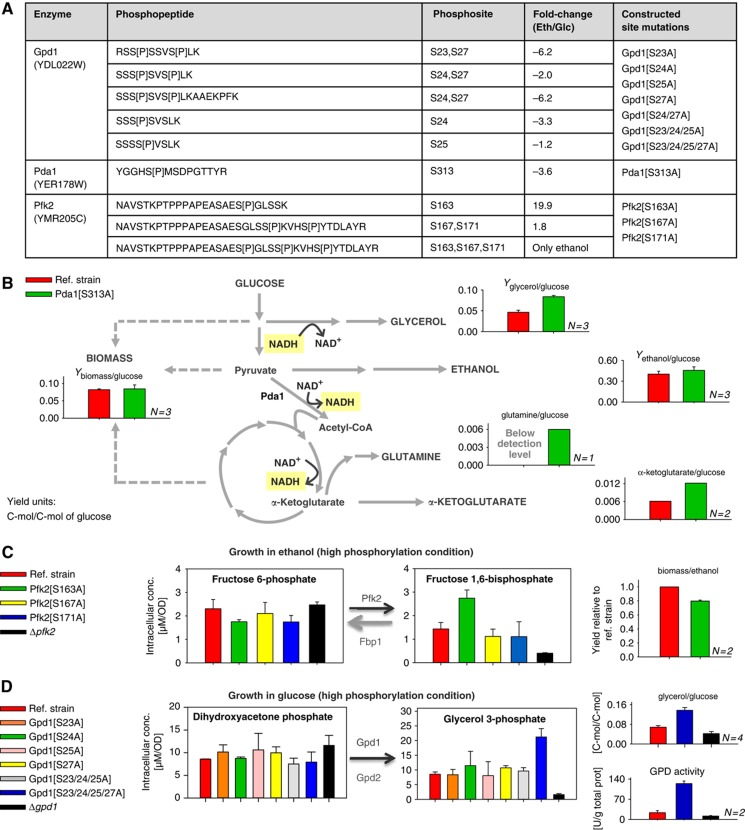
As a frequent post-translational modification, protein phosphorylation regulates many cellular processes. Although several hundred phosphorylation sites have been mapped to metabolic enzymes in Saccharomyces cerevisiae, functionality was demonstrated for few of them. Here, we describe a novel approach to identify in vivo functionality of enzyme phosphorylation by combining flux analysis with proteomics and phosphoproteomics. Focusing on the network of 204 enzymes that constitute the yeast central carbon and amino-acid metabolism, we combined protein and phosphoprotein levels to identify 35 enzymes that change their degree of phosphorylation during growth under five conditions. Correlations between previously determined intracellular fluxes and phosphoprotein abundances provided first functional evidence for five novel phosphoregulated enzymes in this network, adding to nine known phosphoenzymes. For the pyruvate dehydrogenase complex E1 α subunit Pda1 and the newly identified phosphoregulated glycerol-3-phosphate dehydrogenase Gpd1 and phosphofructose-1-kinase complex β subunit Pfk2, we then validated functionality of specific phosphosites through absolute peptide quantification by targeted mass spectrometry, metabolomics and physiological flux analysis in mutants with genetically removed phosphosites. These results demonstrate the role of phosphorylation in controlling the metabolic flux realised by these three enzymes.
Conflict of interest statement
The authors declare that they have no conflict of interest.
Figures


Similar articles
-
Comprehensive quantitative analysis of central carbon and amino-acid metabolism in Saccharomyces cerevisiae under multiple conditions by targeted proteomics.Mol Syst Biol. 2011 Feb 1;7:464. doi: 10.1038/msb.2010.122. Mol Syst Biol. 2011. PMID: 21283140 Free PMC article.
-
Phosphoproteomic analysis of protein kinase C signaling in Saccharomyces cerevisiae reveals Slt2 mitogen-activated protein kinase (MAPK)-dependent phosphorylation of eisosome core components.Mol Cell Proteomics. 2013 Mar;12(3):557-74. doi: 10.1074/mcp.M112.020438. Epub 2012 Dec 9. Mol Cell Proteomics. 2013. PMID: 23221999 Free PMC article.
-
Integrative proteomics and biochemical analyses define Ptc6p as the Saccharomyces cerevisiae pyruvate dehydrogenase phosphatase.J Biol Chem. 2017 Jul 14;292(28):11751-11759. doi: 10.1074/jbc.M117.787341. Epub 2017 May 24. J Biol Chem. 2017. PMID: 28539364 Free PMC article.
-
Flux control through protein phosphorylation in yeast.FEMS Yeast Res. 2016 Dec 1;16(8). doi: 10.1093/femsyr/fow096. FEMS Yeast Res. 2016. PMID: 27797916 Review.
-
The importance of post-translational modifications in regulating Saccharomyces cerevisiae metabolism.FEMS Yeast Res. 2012 Mar;12(2):104-17. doi: 10.1111/j.1567-1364.2011.00765.x. Epub 2011 Dec 22. FEMS Yeast Res. 2012. PMID: 22128902 Review.
Cited by
-
Proteomic analysis indicates massive changes in metabolism prior to the inhibition of growth and photosynthesis of grapevine (Vitis vinifera L.) in response to water deficit.BMC Plant Biol. 2013 Mar 21;13:49. doi: 10.1186/1471-2229-13-49. BMC Plant Biol. 2013. PMID: 23514573 Free PMC article.
-
Coordination of microbial metabolism.Nat Rev Microbiol. 2014 May;12(5):327-40. doi: 10.1038/nrmicro3238. Epub 2014 Mar 24. Nat Rev Microbiol. 2014. PMID: 24658329 Review.
-
The UBR-1 ubiquitin ligase regulates glutamate metabolism to generate coordinated motor pattern in Caenorhabditis elegans.PLoS Genet. 2018 Apr 12;14(4):e1007303. doi: 10.1371/journal.pgen.1007303. eCollection 2018 Apr. PLoS Genet. 2018. PMID: 29649217 Free PMC article.
-
Personalized phosphoproteomics identifies functional signaling.Nat Biotechnol. 2022 Apr;40(4):576-584. doi: 10.1038/s41587-021-01099-9. Epub 2021 Dec 2. Nat Biotechnol. 2022. PMID: 34857927
-
Global analysis of protein structural changes in complex proteomes.Nat Biotechnol. 2014 Oct;32(10):1036-44. doi: 10.1038/nbt.2999. Epub 2014 Sep 14. Nat Biotechnol. 2014. PMID: 25218519
References
-
- Banaszak K, Mechin I, Obmolova G, Oldham M, Chang SH, Ruiz T, Radermacher M, Kopperschlager G, Rypniewski W (2011) The crystal structures of eukaryotic phosphofructokinases from baker's yeast and rabbit skeletal muscle. J Mol Biol 407: 284–297 - PubMed
-
- Bodenmiller B, Aebersold R (2010) Quantitative analysis of protein phosphorylation on a system-wide scale by mass spectrometry-based proteomics. Methods Enzymol 470: 317–334 - PubMed
Publication types
MeSH terms
Substances
LinkOut - more resources
Full Text Sources
Other Literature Sources
Molecular Biology Databases
Research Materials
Miscellaneous
